Make sense of your data

Connect health, weather, markets, and more — discover the patterns behind your life.

Beautiful dashboards that overlay your personal data across domains and reveal connections you'd never spot in isolation.

Free to start. No account required.

VoilàSense Climate Drive dashboard showing green line charts VoilàSense Climate Drive dashboard in dark mode

Your data already exists

Your phone already tracks your steps, your sleep, your heart rate. Weather services record every degree. Markets tick every second.

All this data exists — scattered across apps, services, and APIs.

A single dashboard can combine health, weather, economic indicators and personal data.

VoilàSense brings it together. Not to collect it, but to help you see it.

Connect what matters

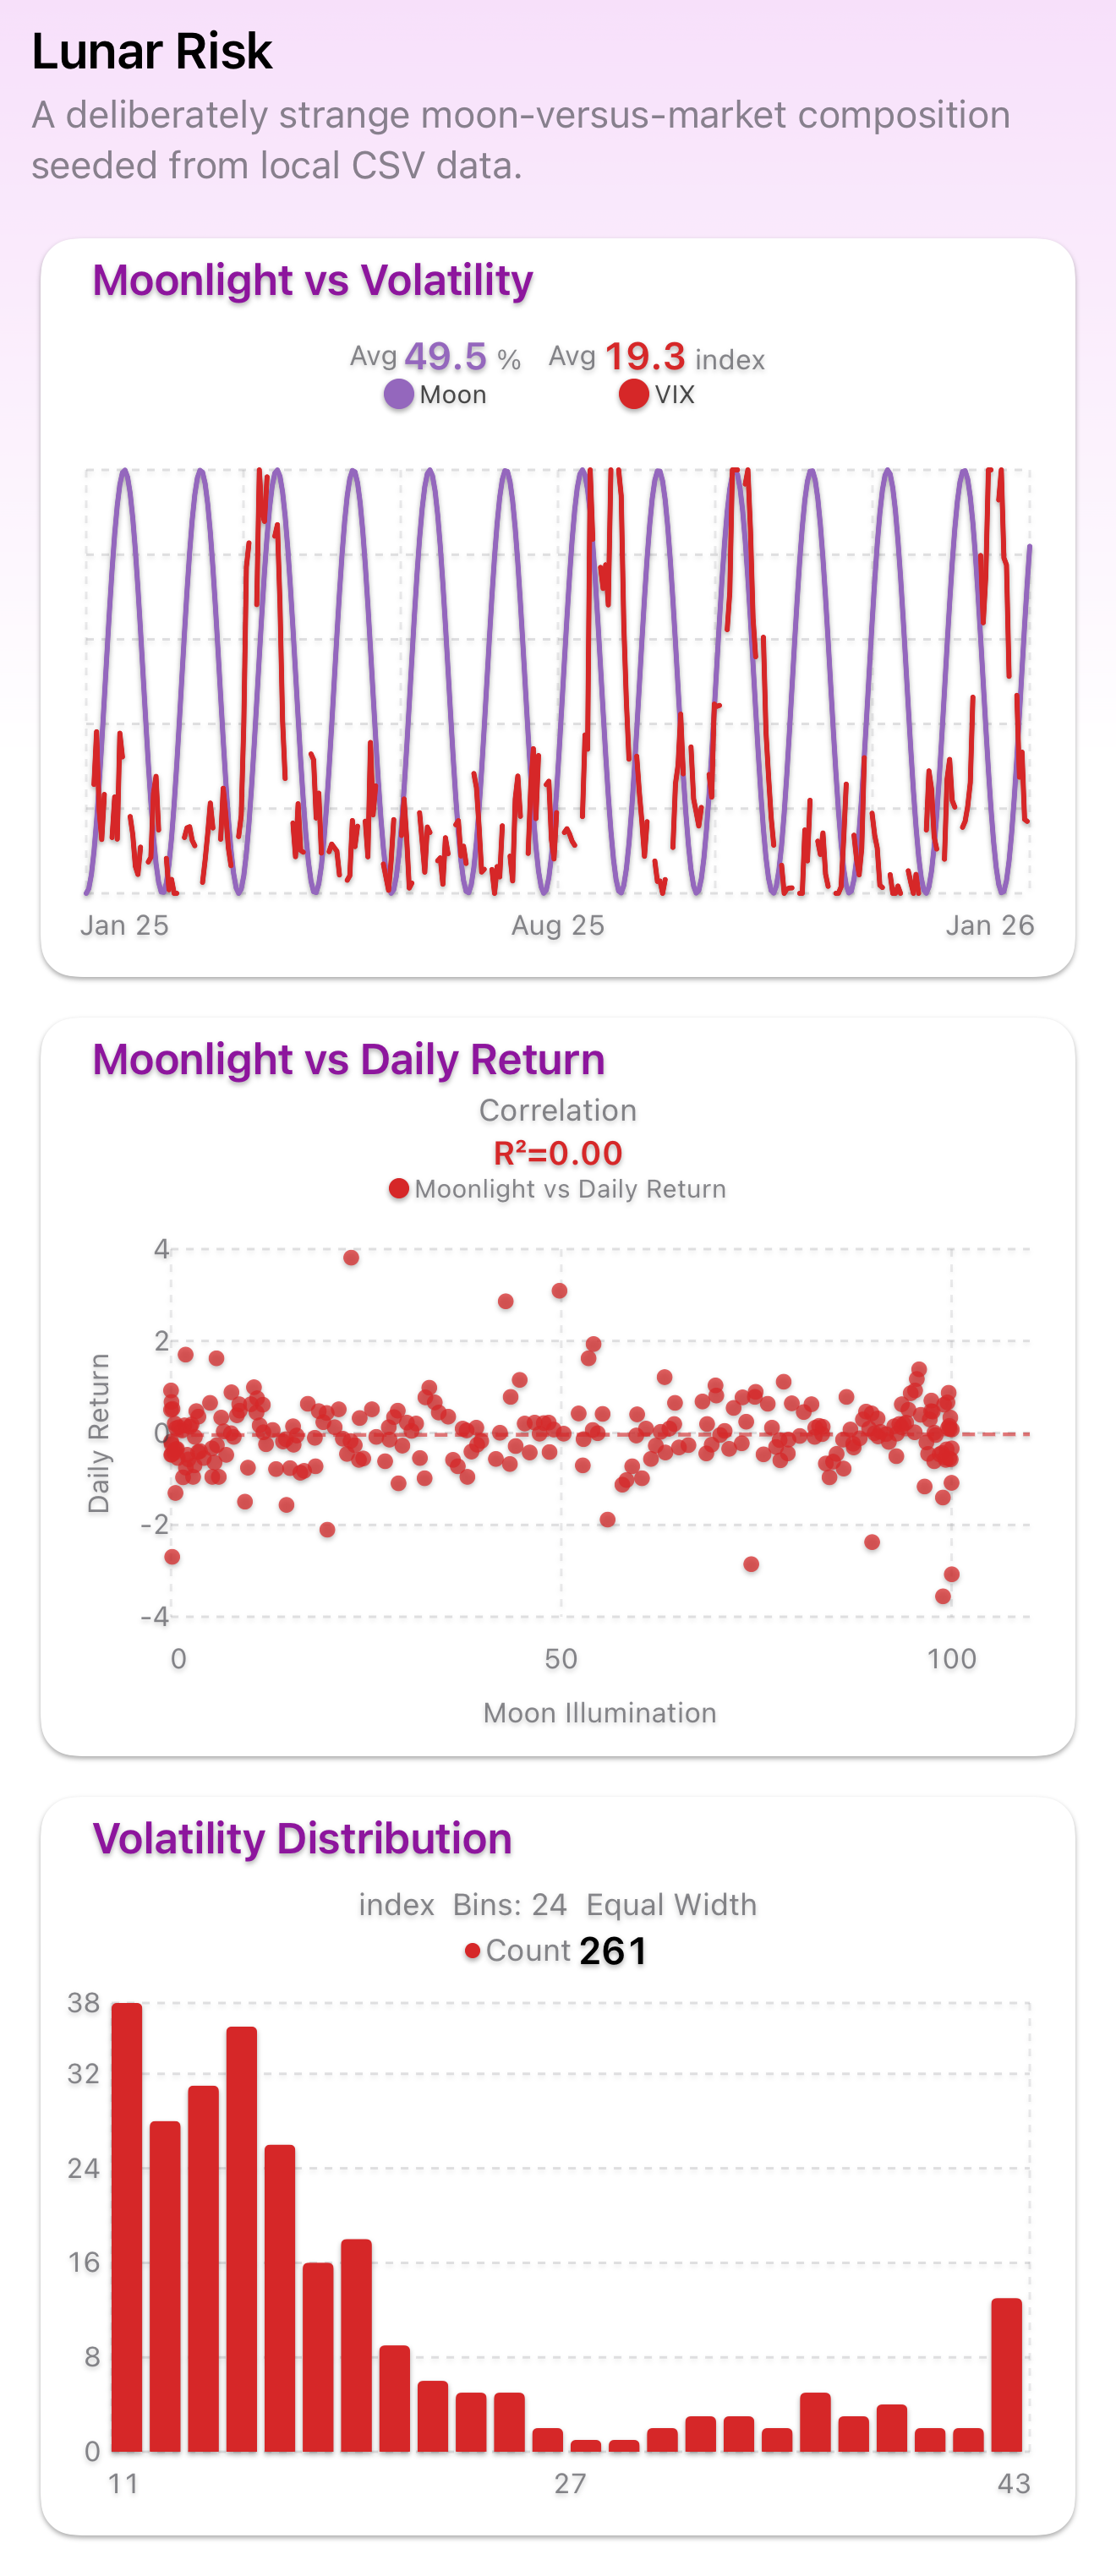
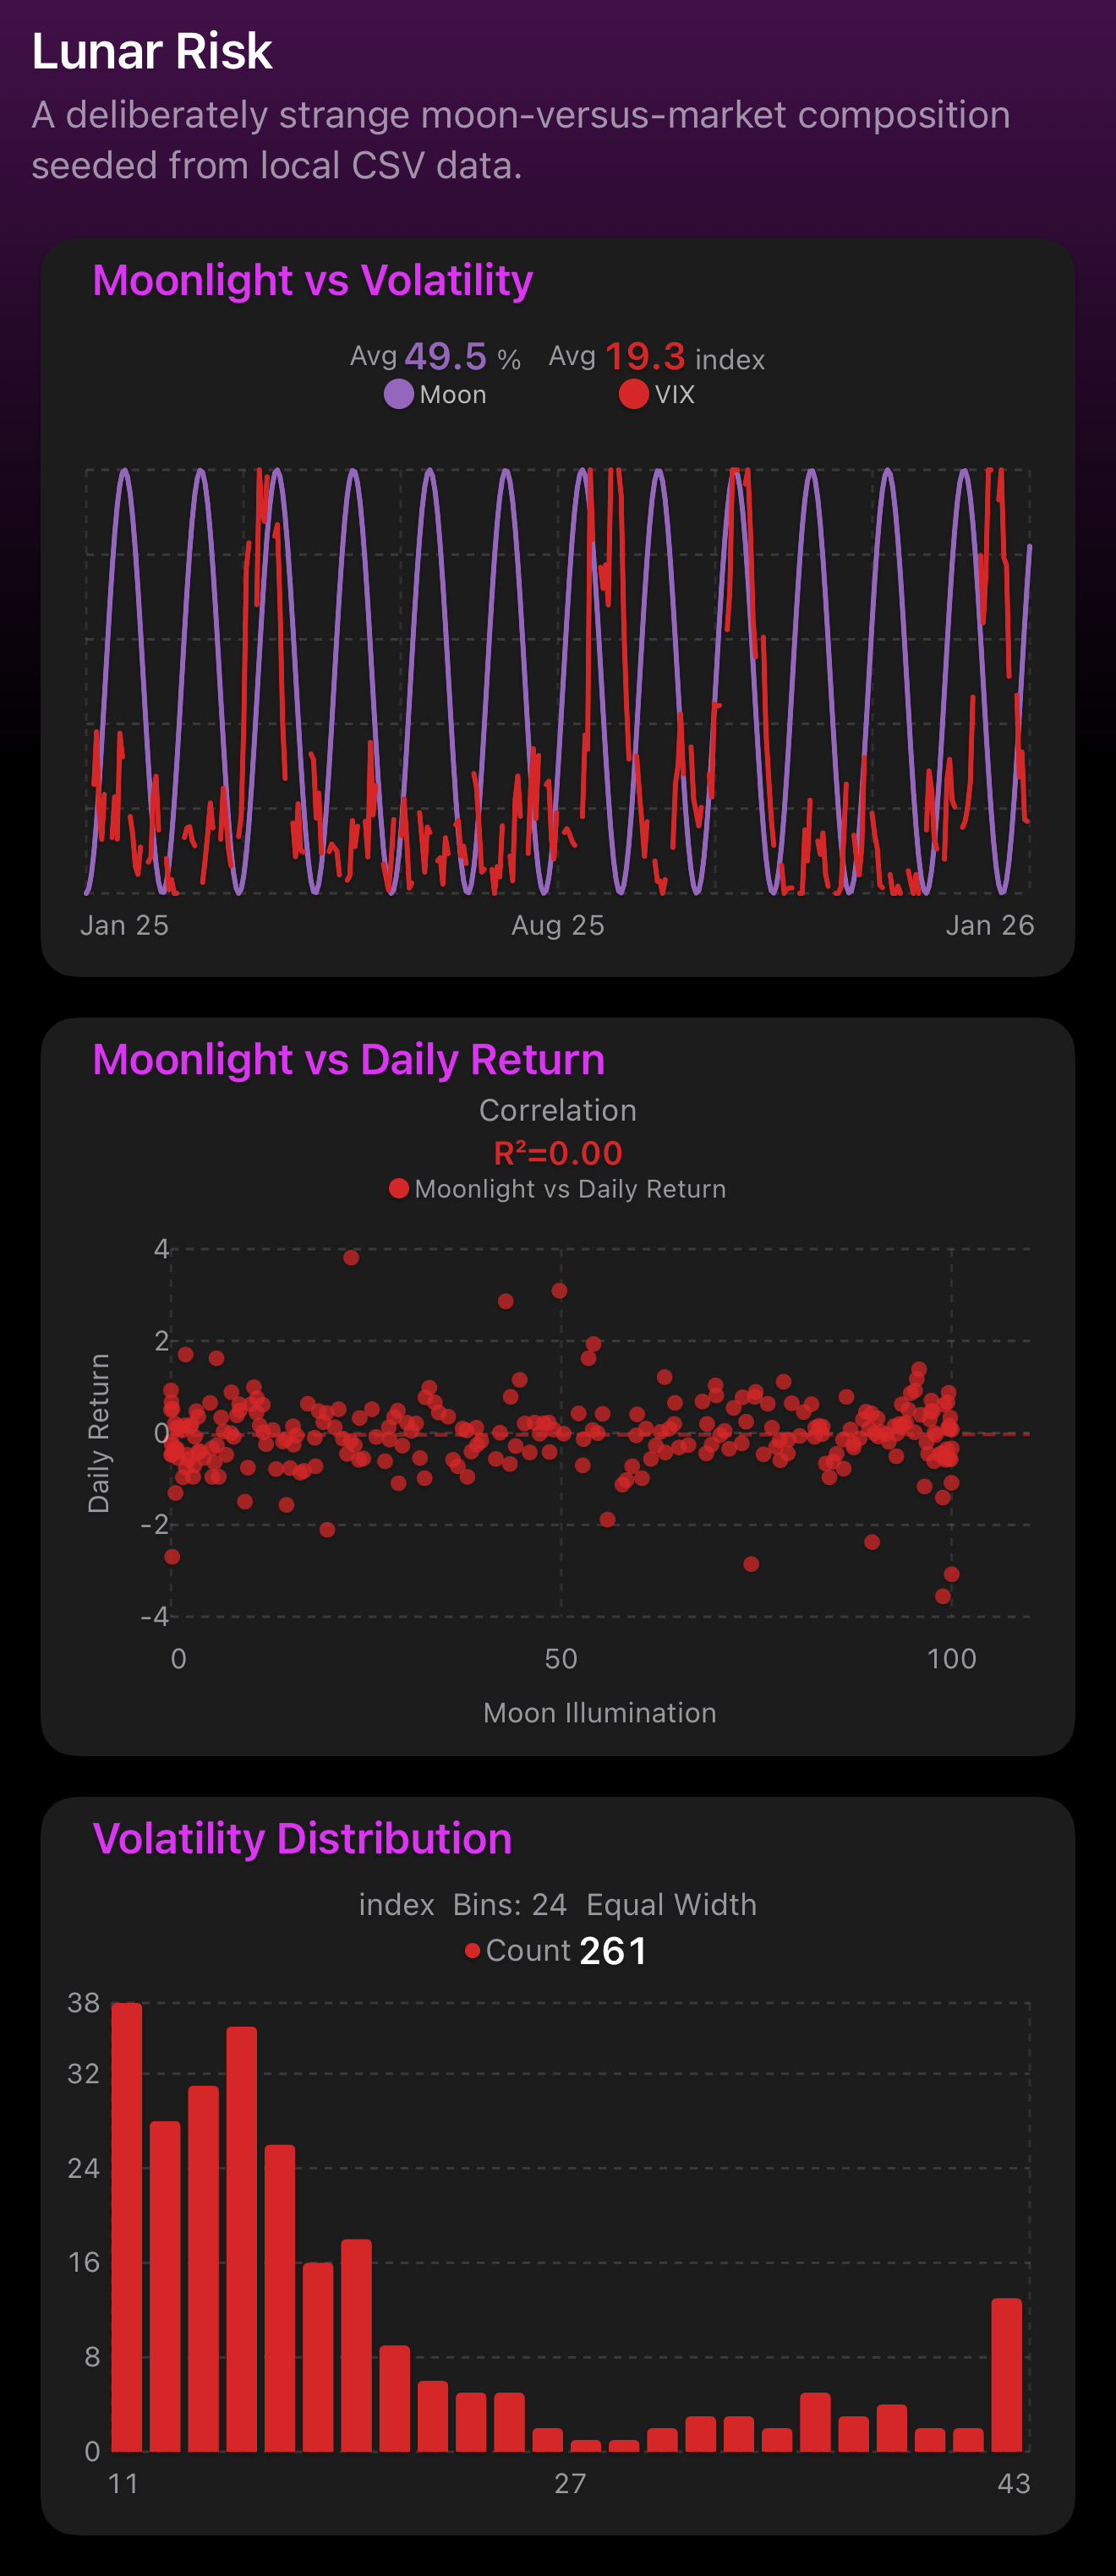
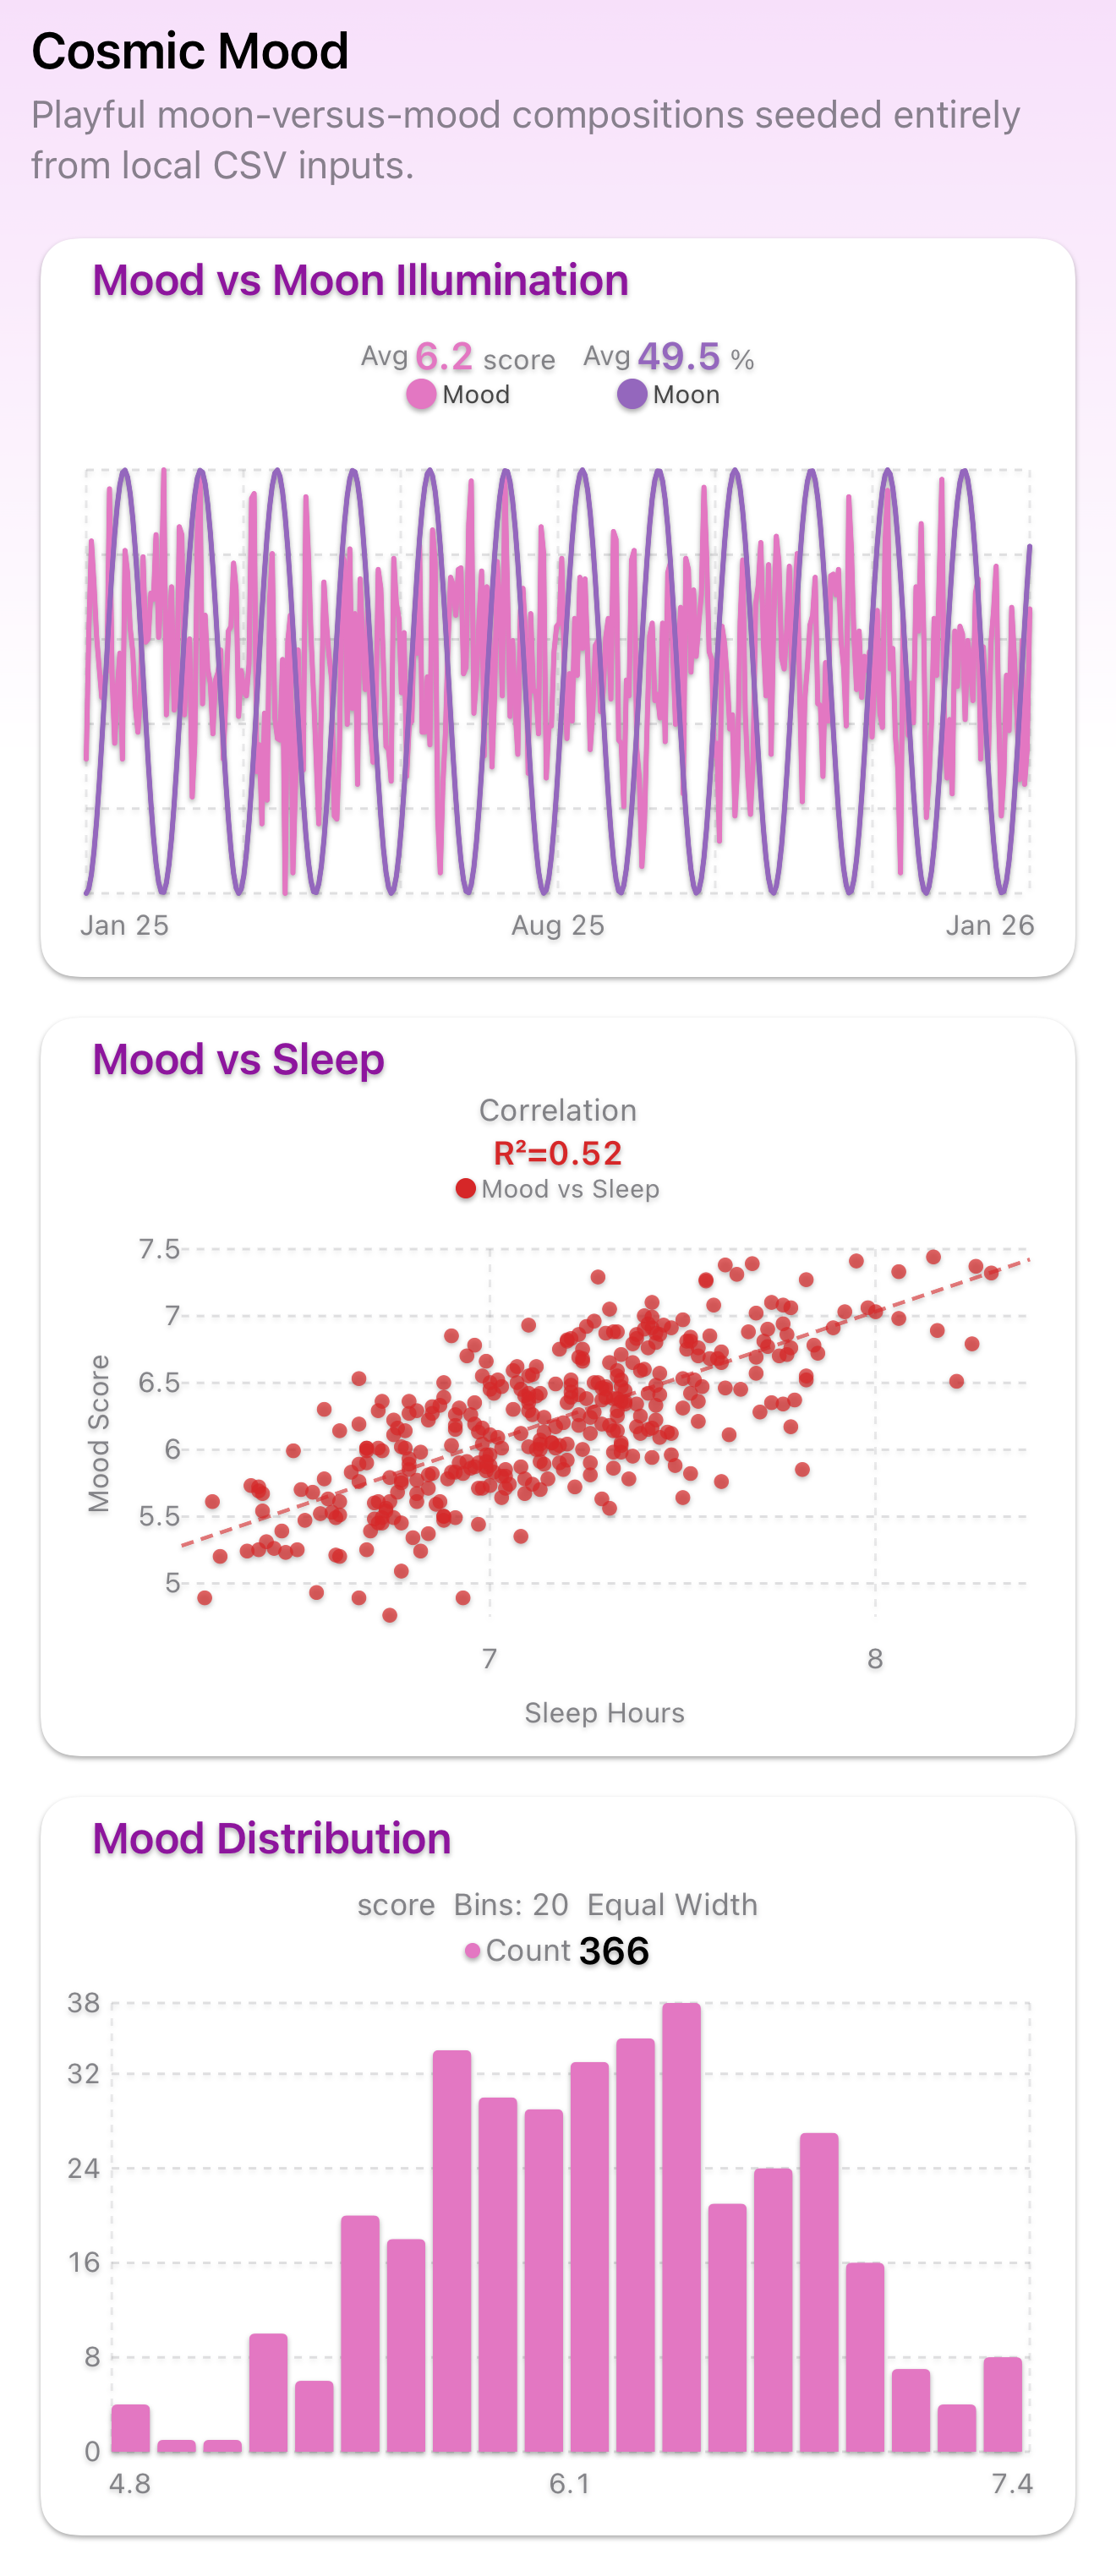
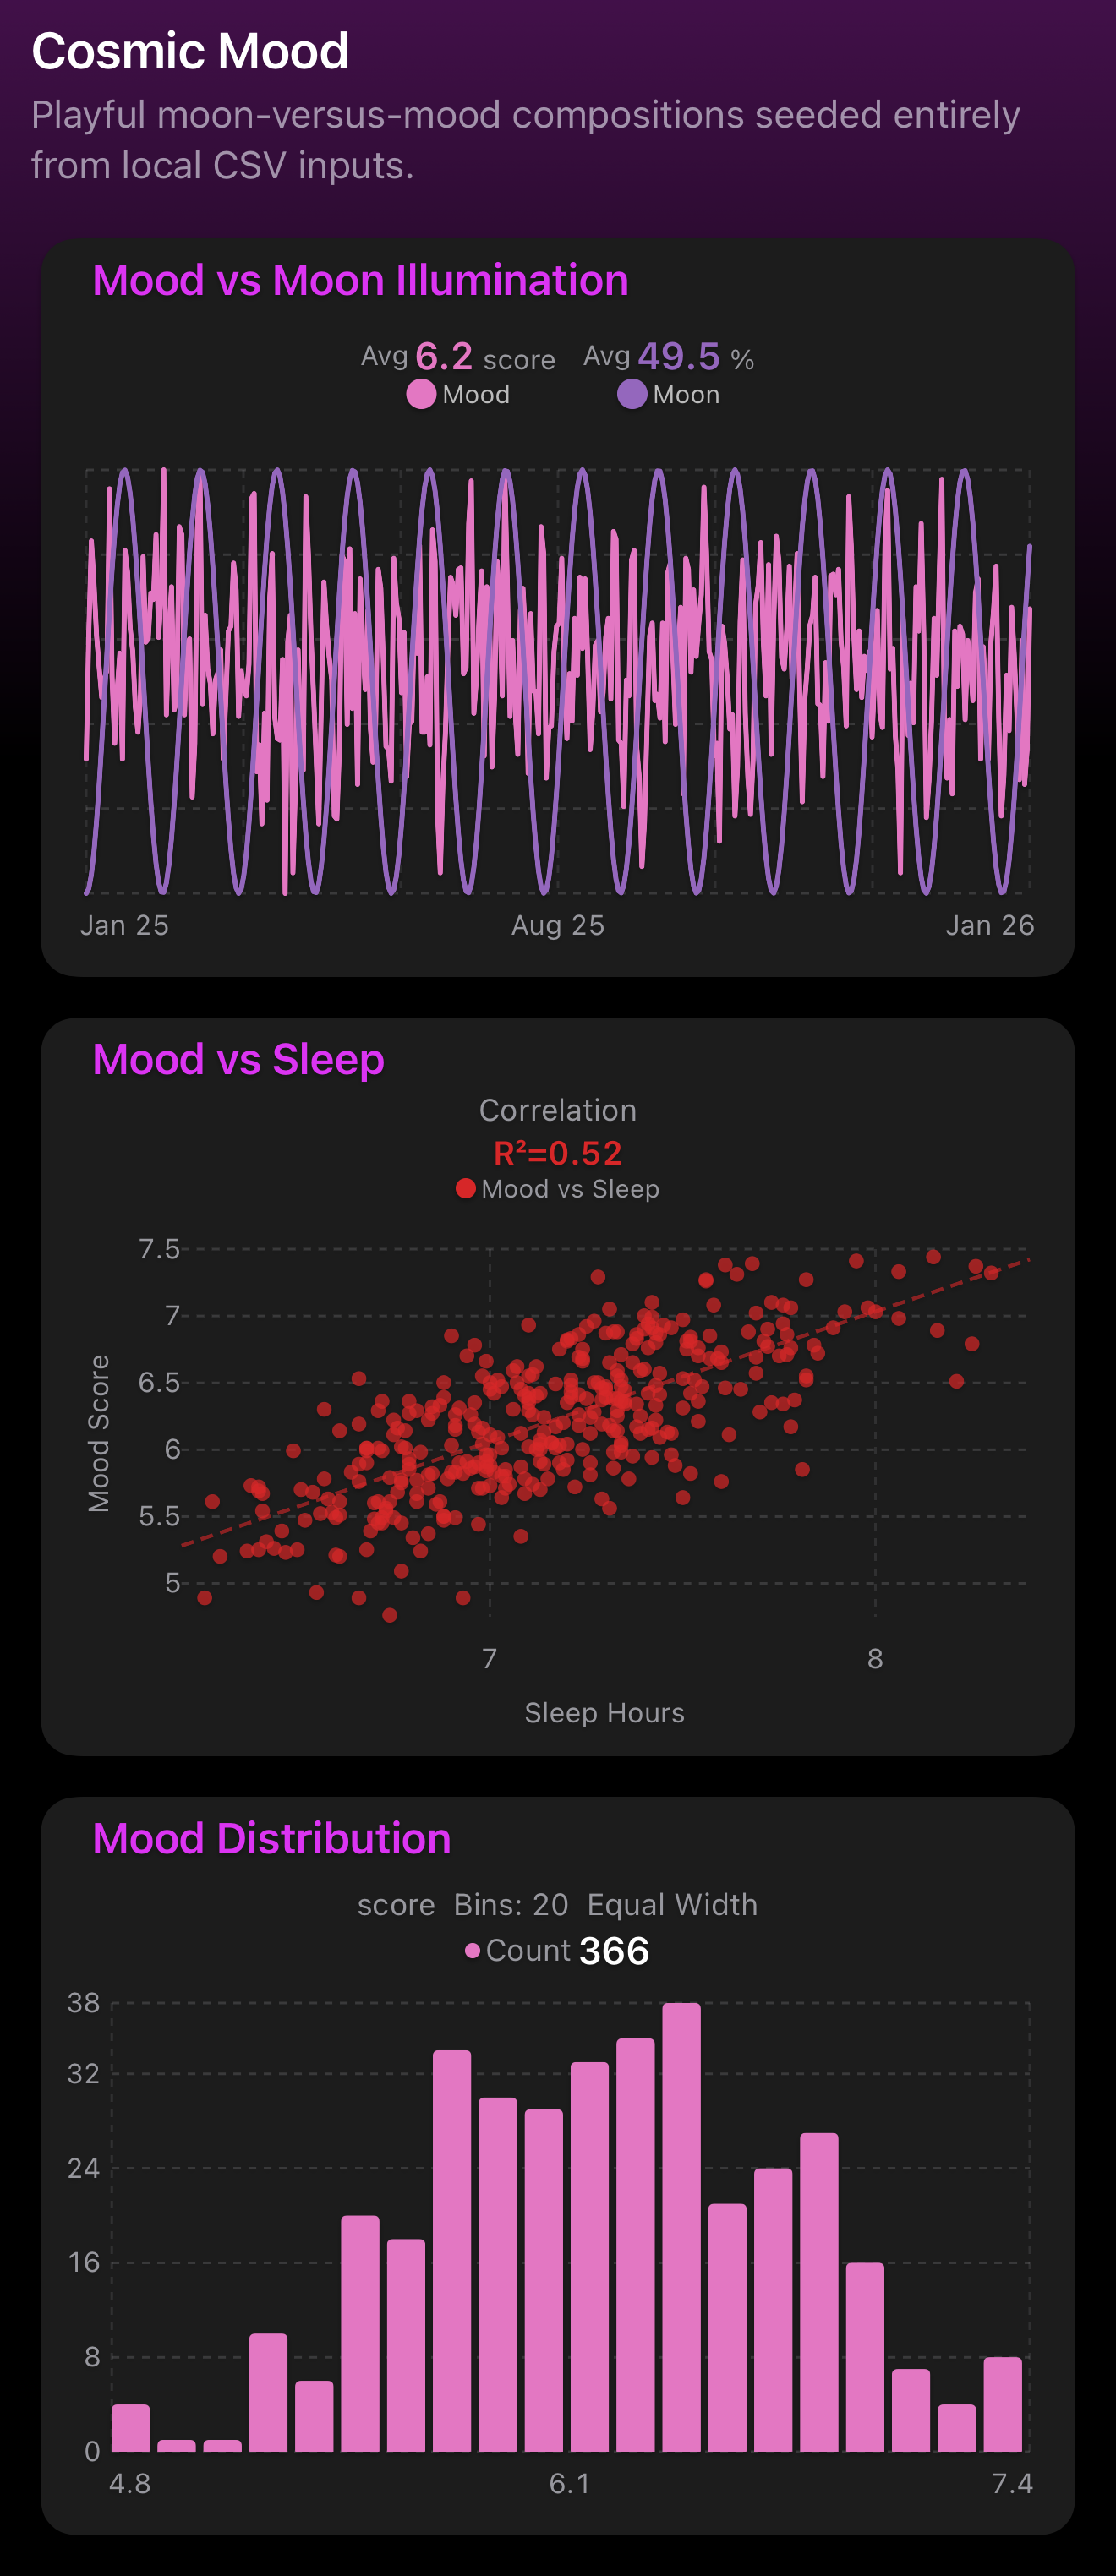
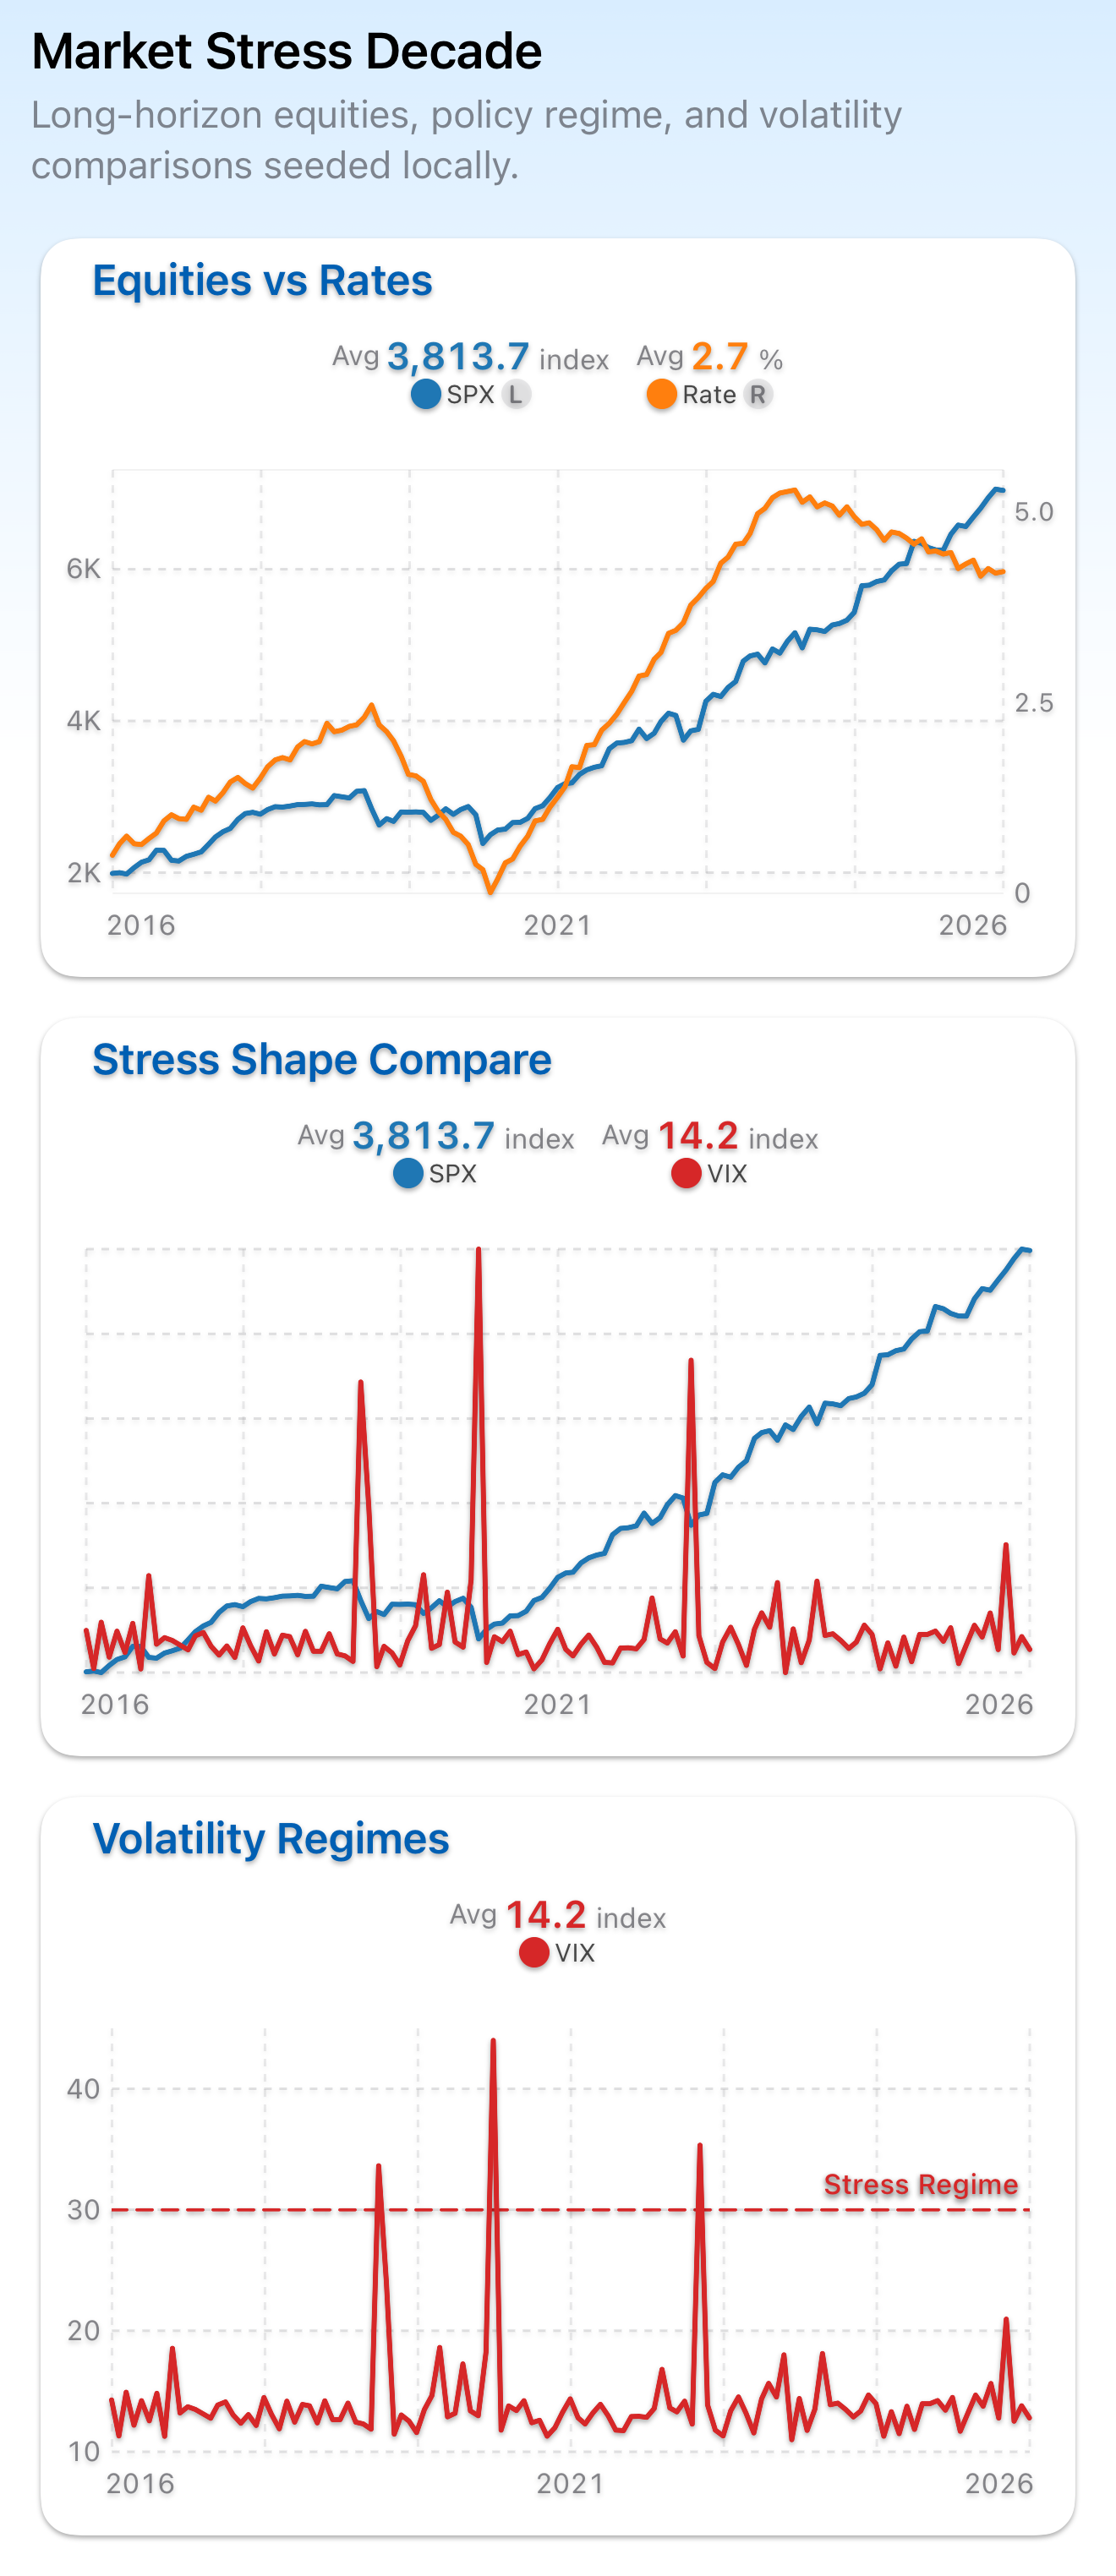
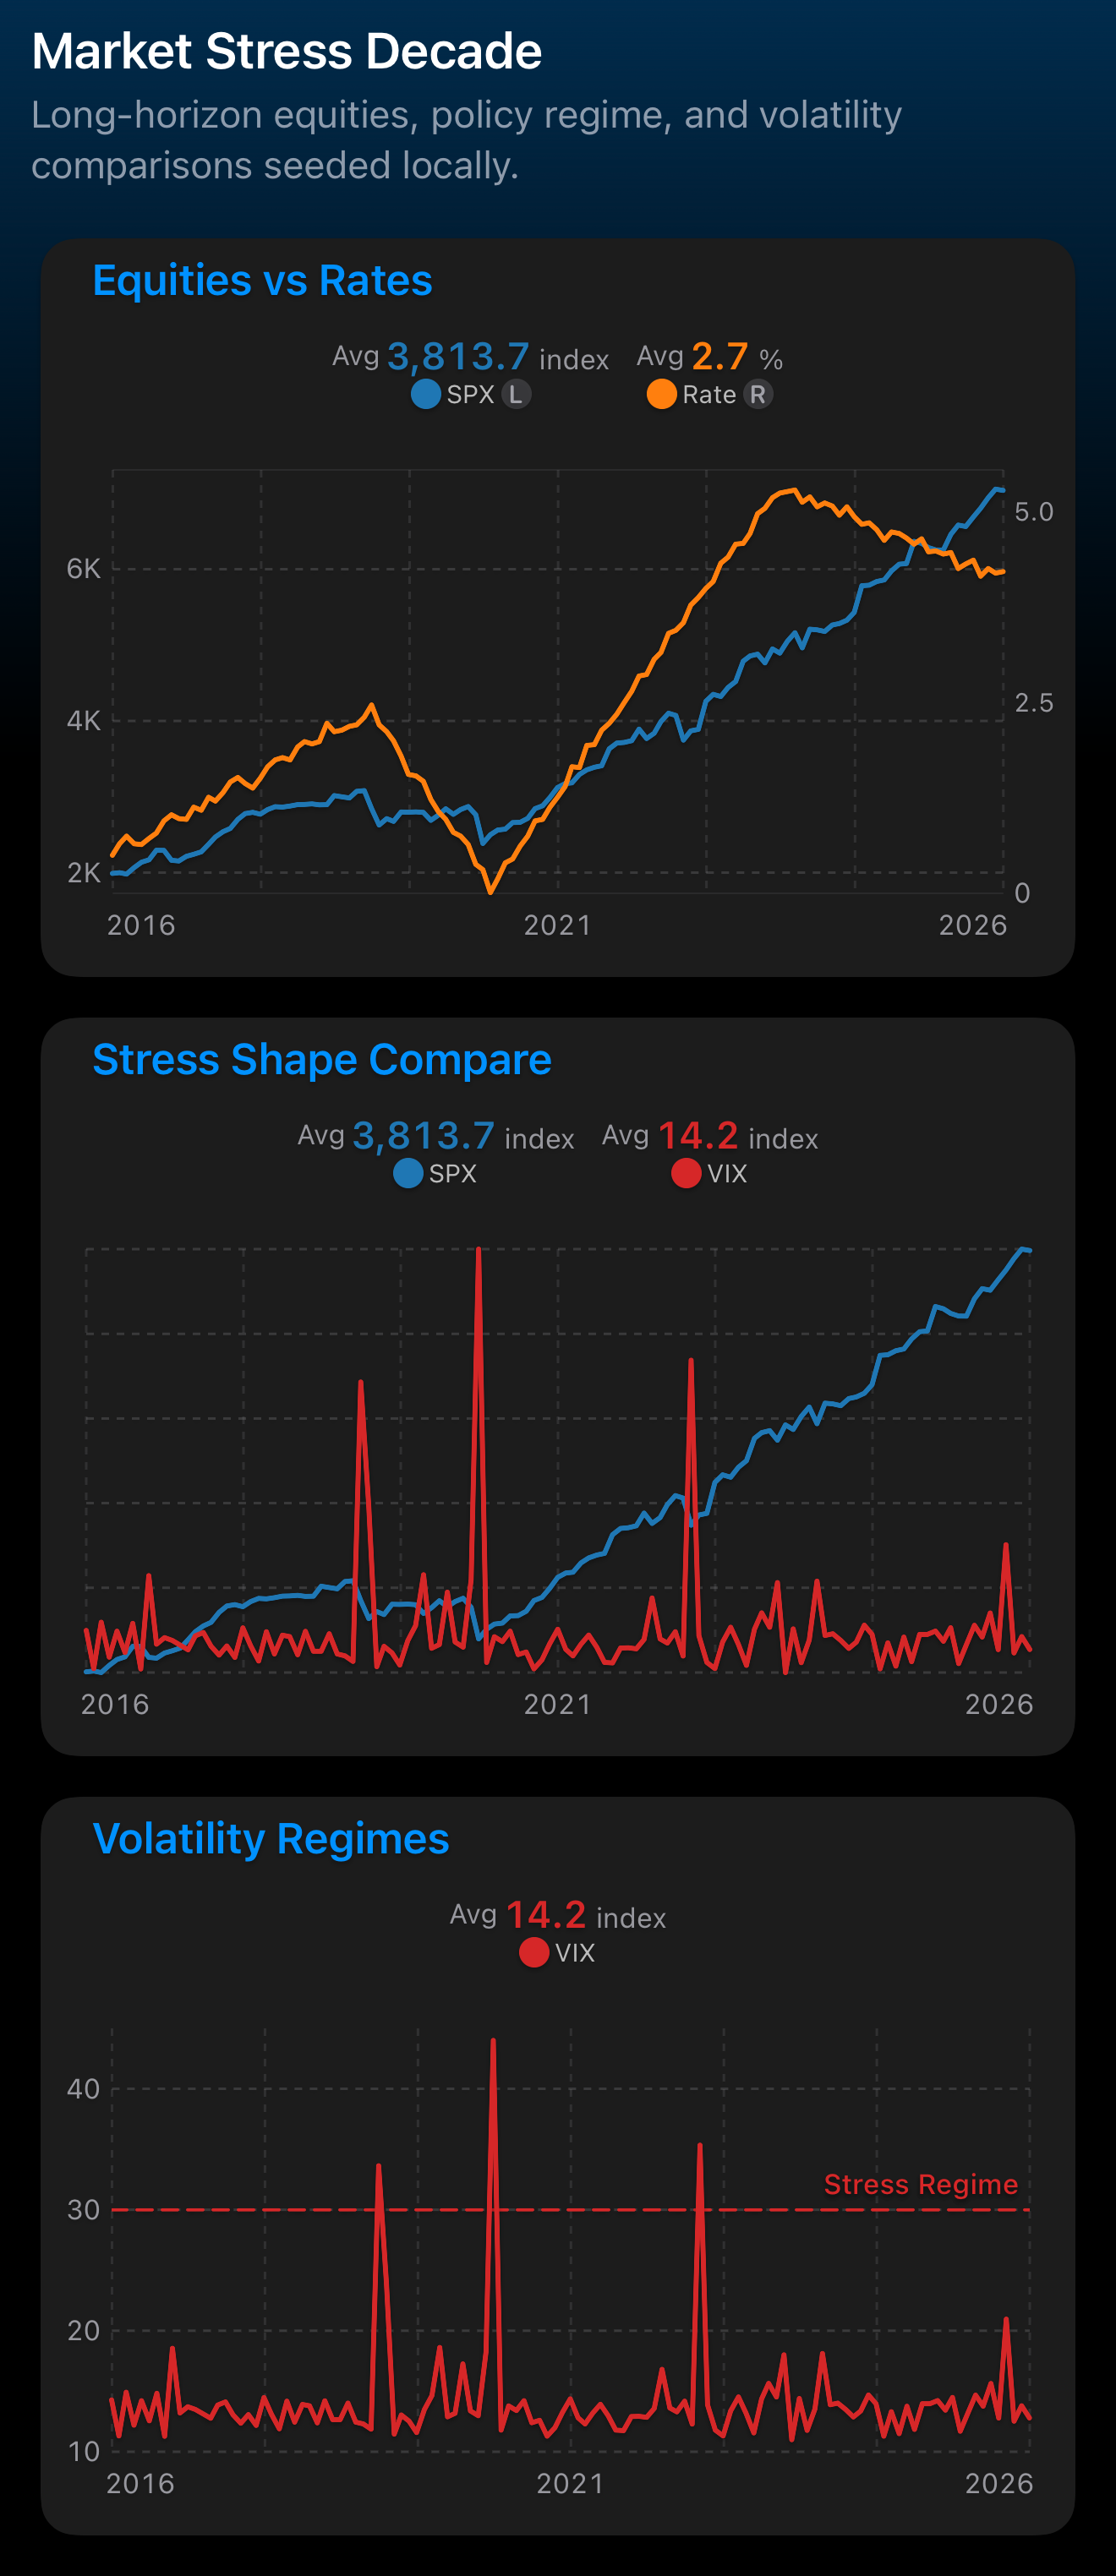
Layer different data sources on the same timeline. See how temperature affects your energy, how moon phases correlate with your mood, how market volatility mirrors your stress.

Climate Drive dashboard with overlaid weather and energy data Climate Drive dashboard with overlaid weather and energy data
Lunar Risk dashboard overlaying moon phases with personal metrics Lunar Risk dashboard overlaying moon phases with personal metrics

See the patterns

Explore surprising cross-domain connections. Here are example dashboards you can build with VoilàSense.

Activity Texture dashboard Activity Texture dashboard dark
Sleep vs TemperatureHow weather shapes your rest
Cosmic Mood dashboard Cosmic Mood dashboard dark
Mood vs Moon phasesLunar cycles and how you feel
Rain Tax dashboard Rain Tax dashboard dark
Steps vs RainDoes weather keep you inside?
Market Texture dashboard Market Texture dashboard dark
Market vs VolatilityFinancial patterns at a glance
Productivity Biome dashboard Productivity Biome dashboard dark
Productivity vs CaffeineYour output, decoded
Performance Distribution dashboard Performance Distribution dashboard dark
Heart Rate vs ActivityExercise through a data lens

Flexible dashboards

Build exactly the view you need. Multiple metrics, six chart types, dual Y-axes, custom time ranges — all in a single screen.

VoilàSense Climate Drive dashboard on iPad showing a full multi-chart layout VoilàSense Climate Drive dashboard on iPad in dark mode
  • Multiple metrics
  • 6 chart types
  • Dual Y-axes
  • Custom time ranges
  • Auto-refresh
  • Data overlays

Start with a template

Explore ready-made dashboards

Pre-built dashboards for common explorations. Pick one, customize it, make it yours.

Sleep Science

A rich sleep dashboard with stages, efficiency, consistency, and moon context.

Sleep Science dashboard preview Sleep Science dashboard preview

Sleep Science

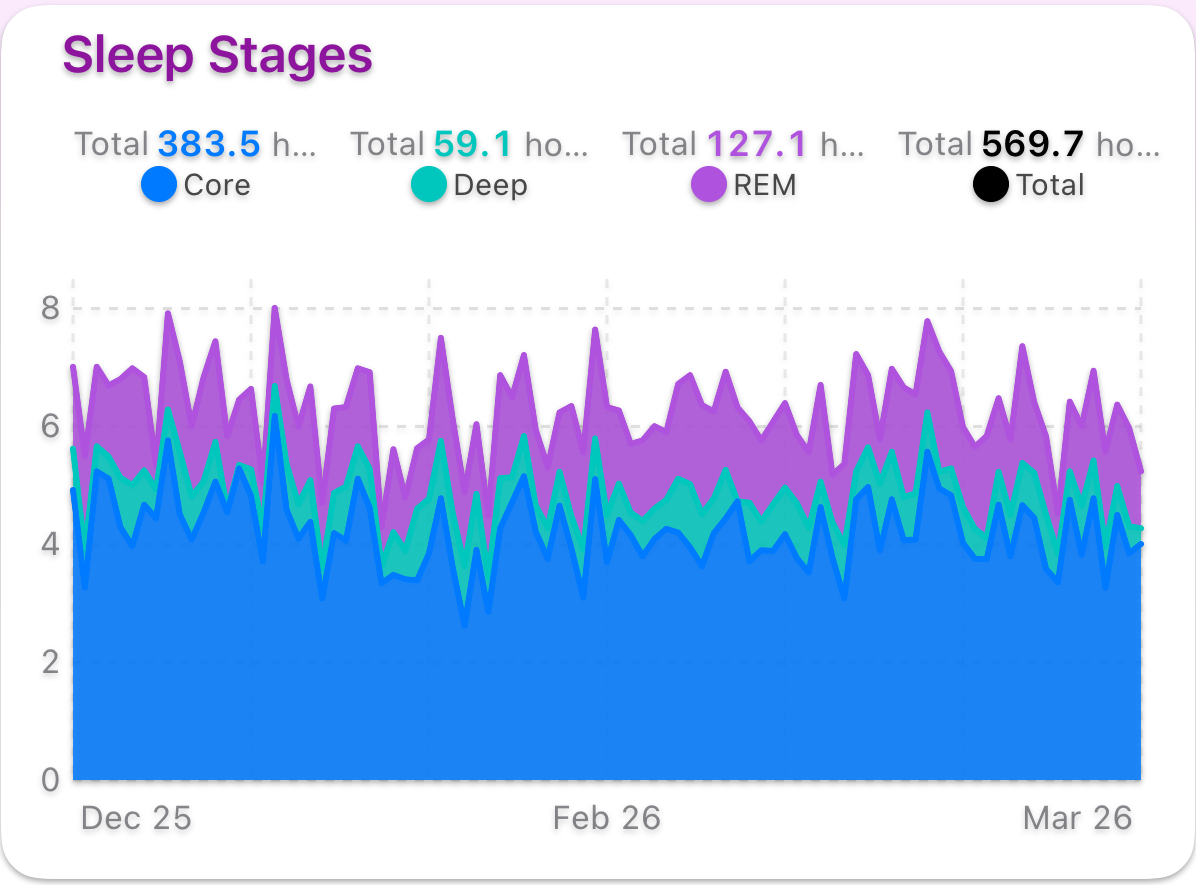
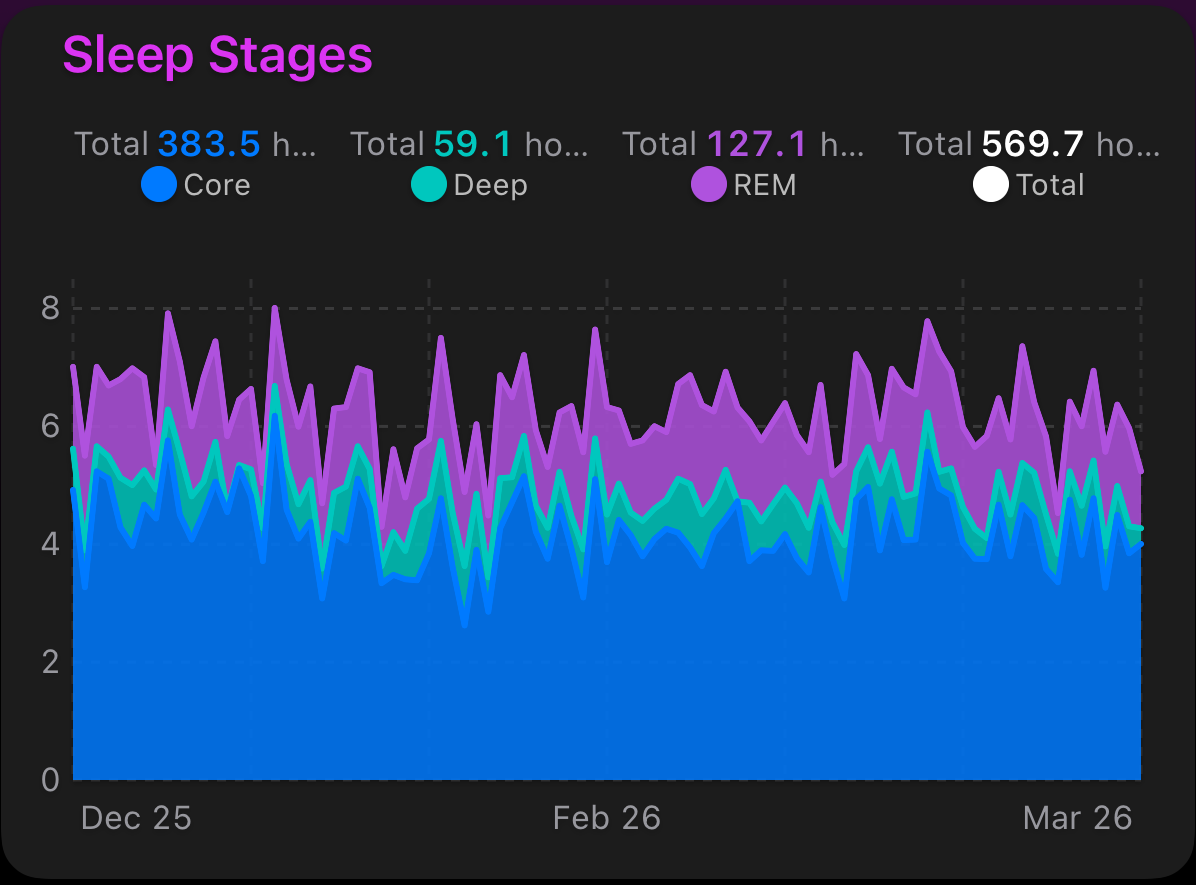
Sleep stages, efficiency, and consistency at a glance.

Activity Texture

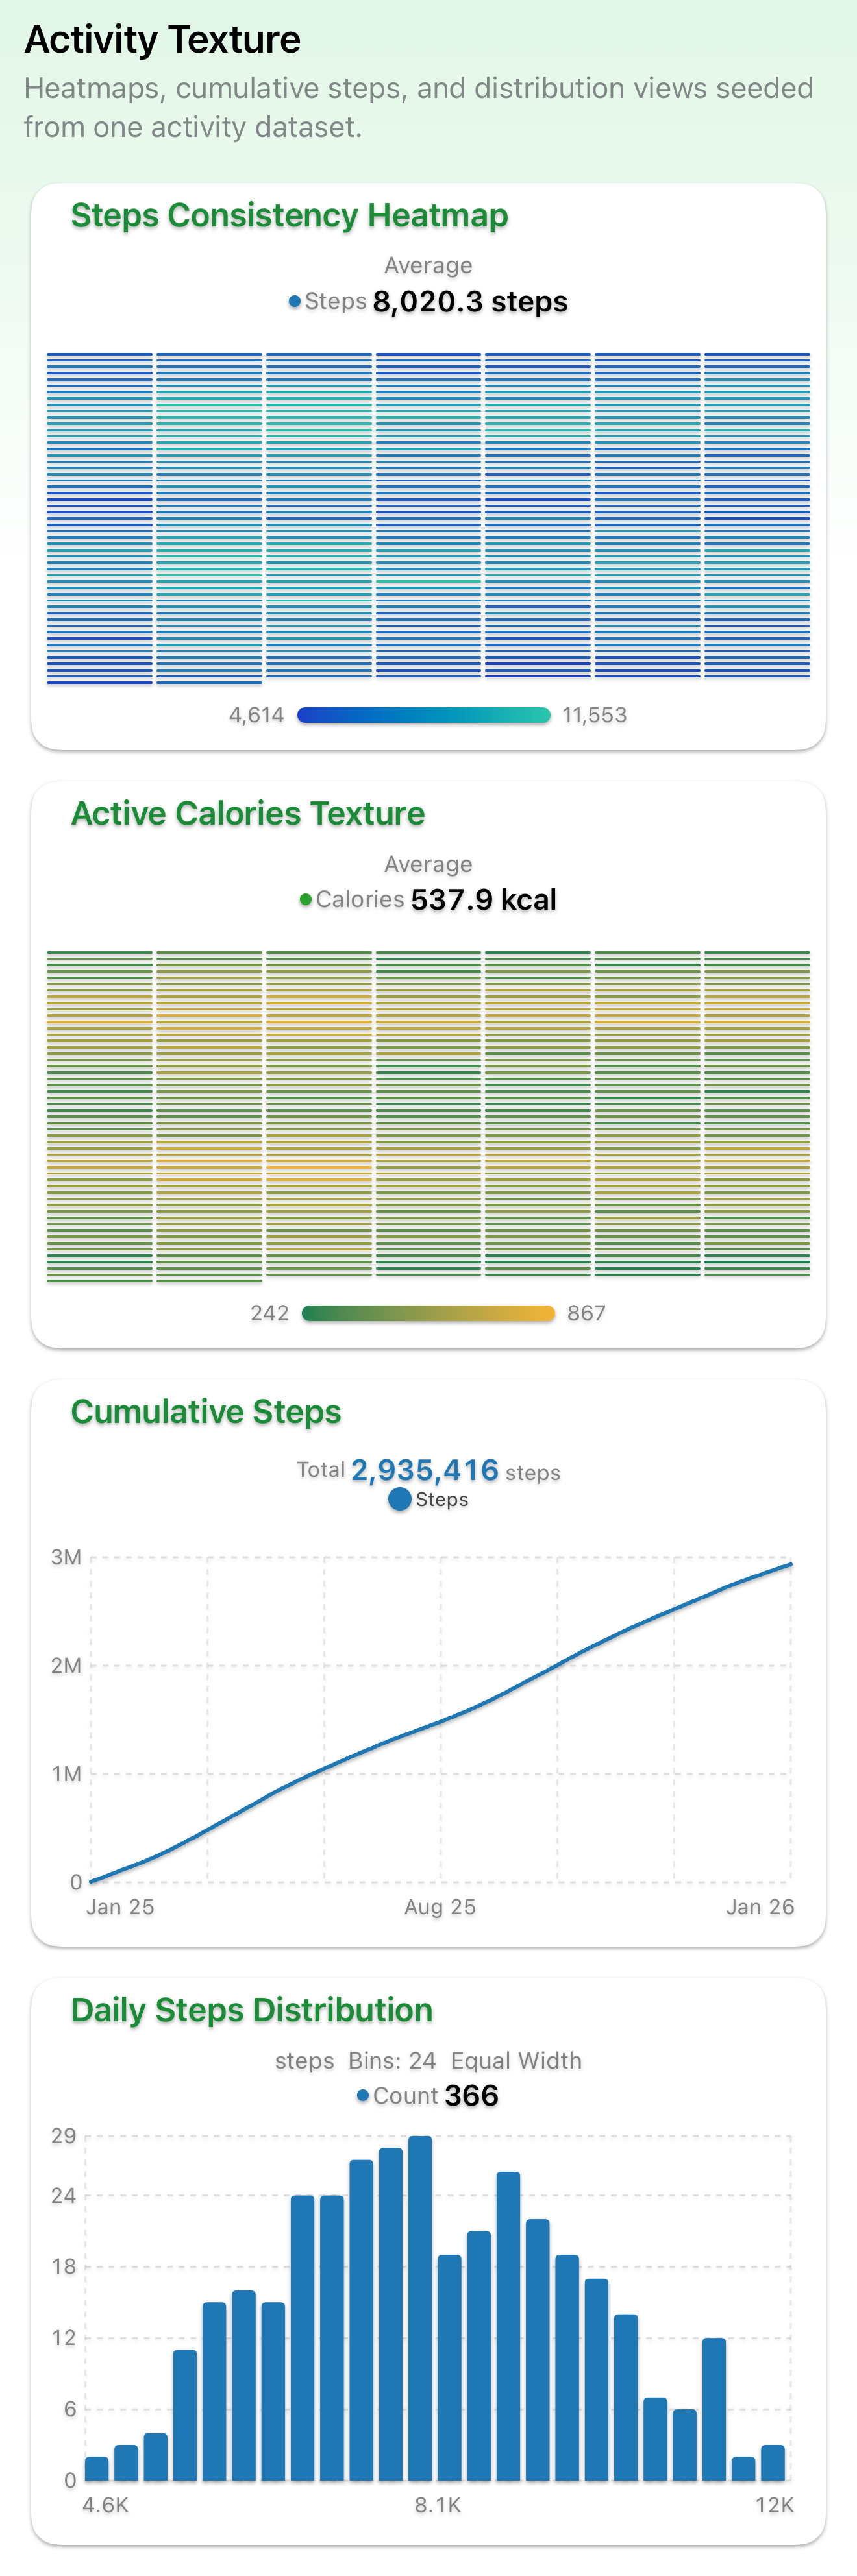
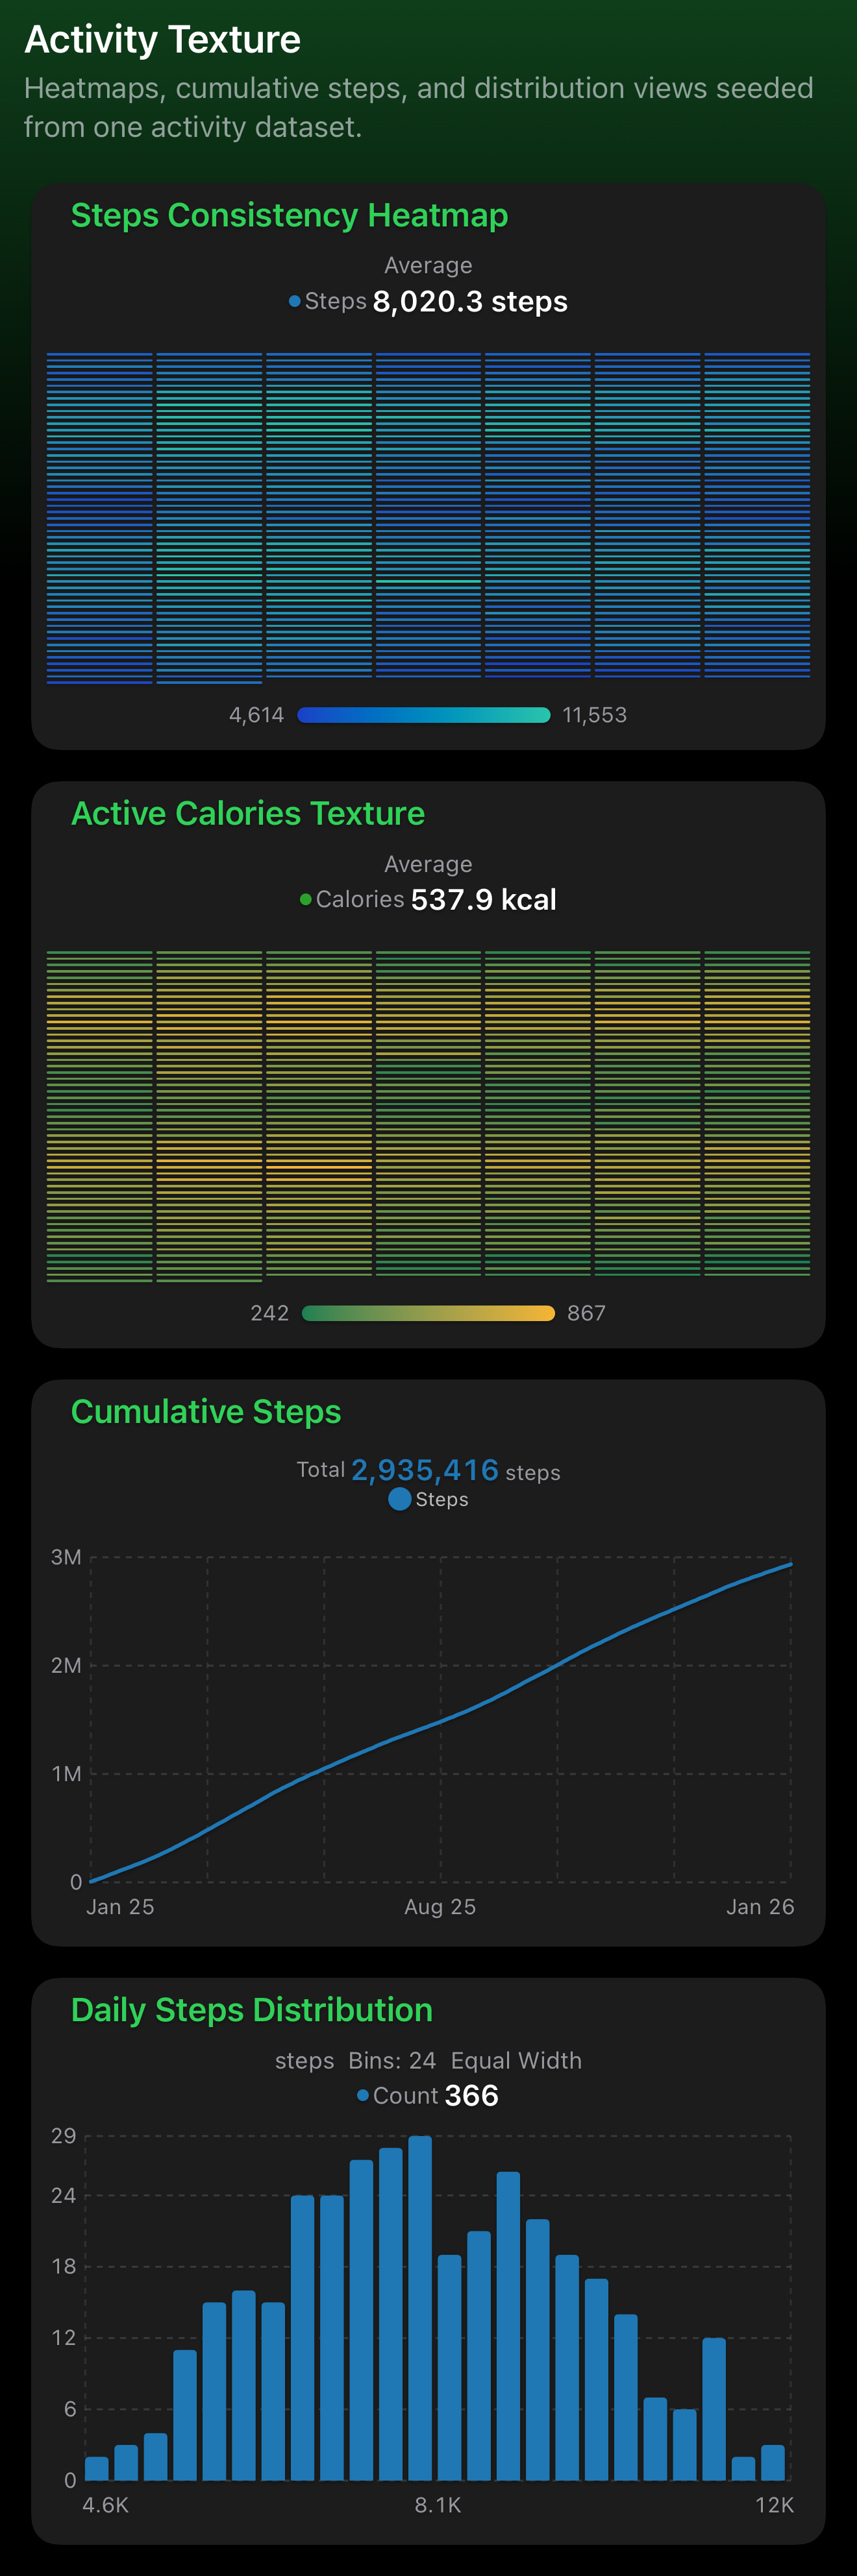
See weekly movement patterns as texture instead of totals.

Activity Texture dashboard preview Activity Texture dashboard preview

Activity Texture

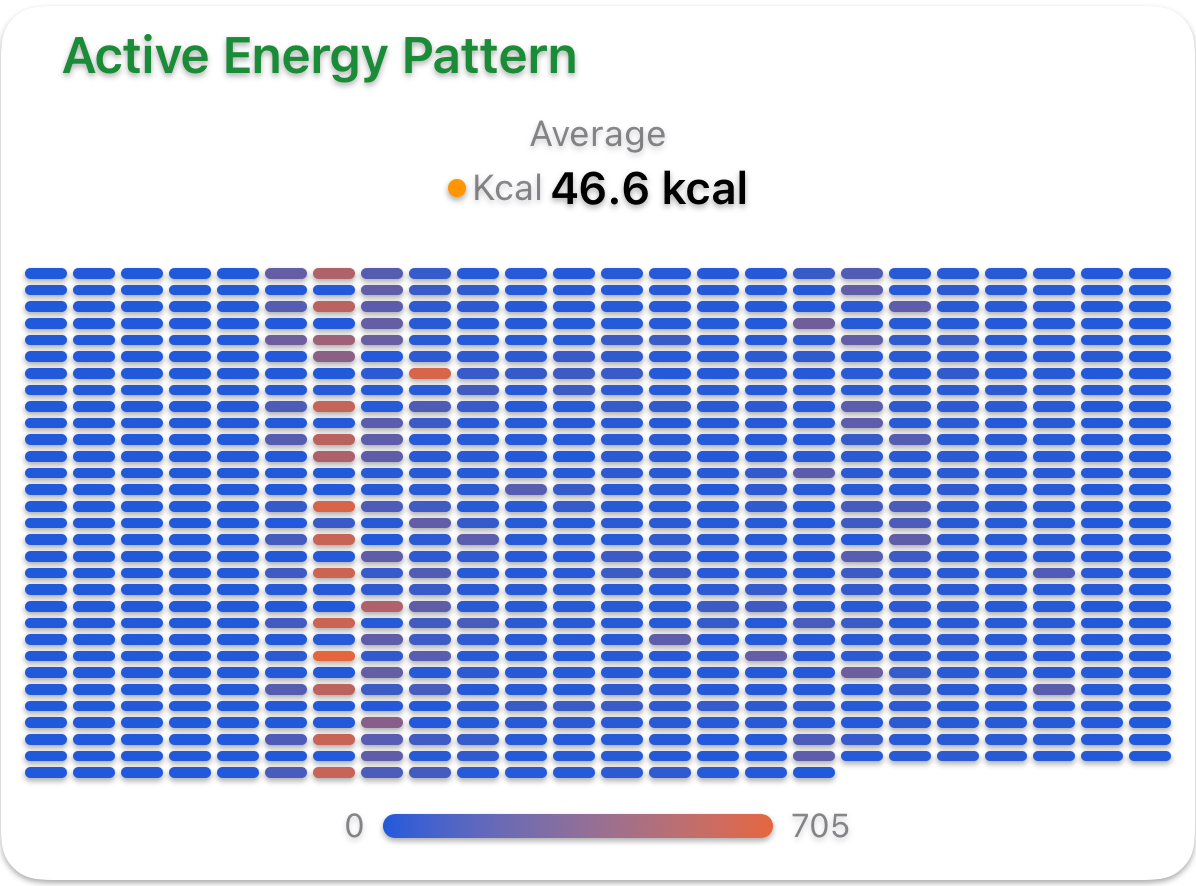
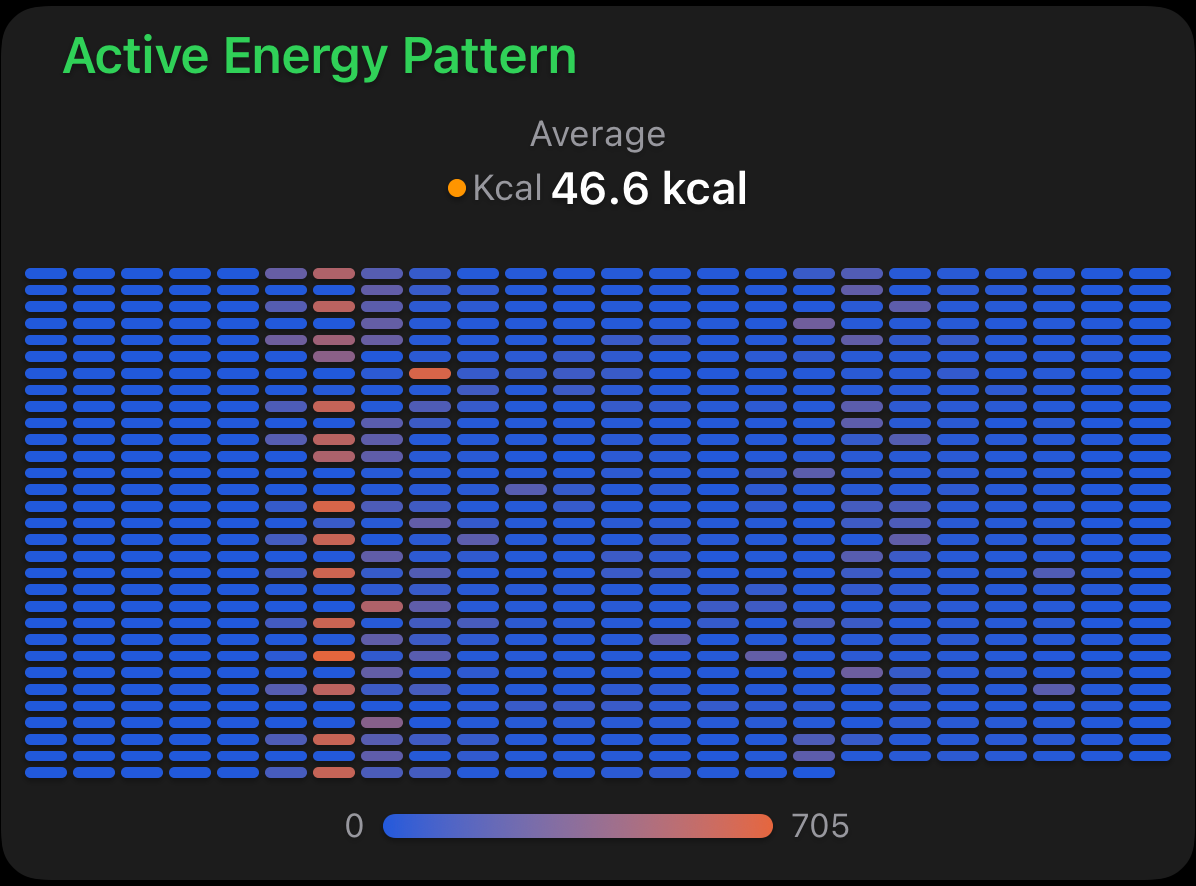
Active energy as a heatmap across time.

Running Performance Lab

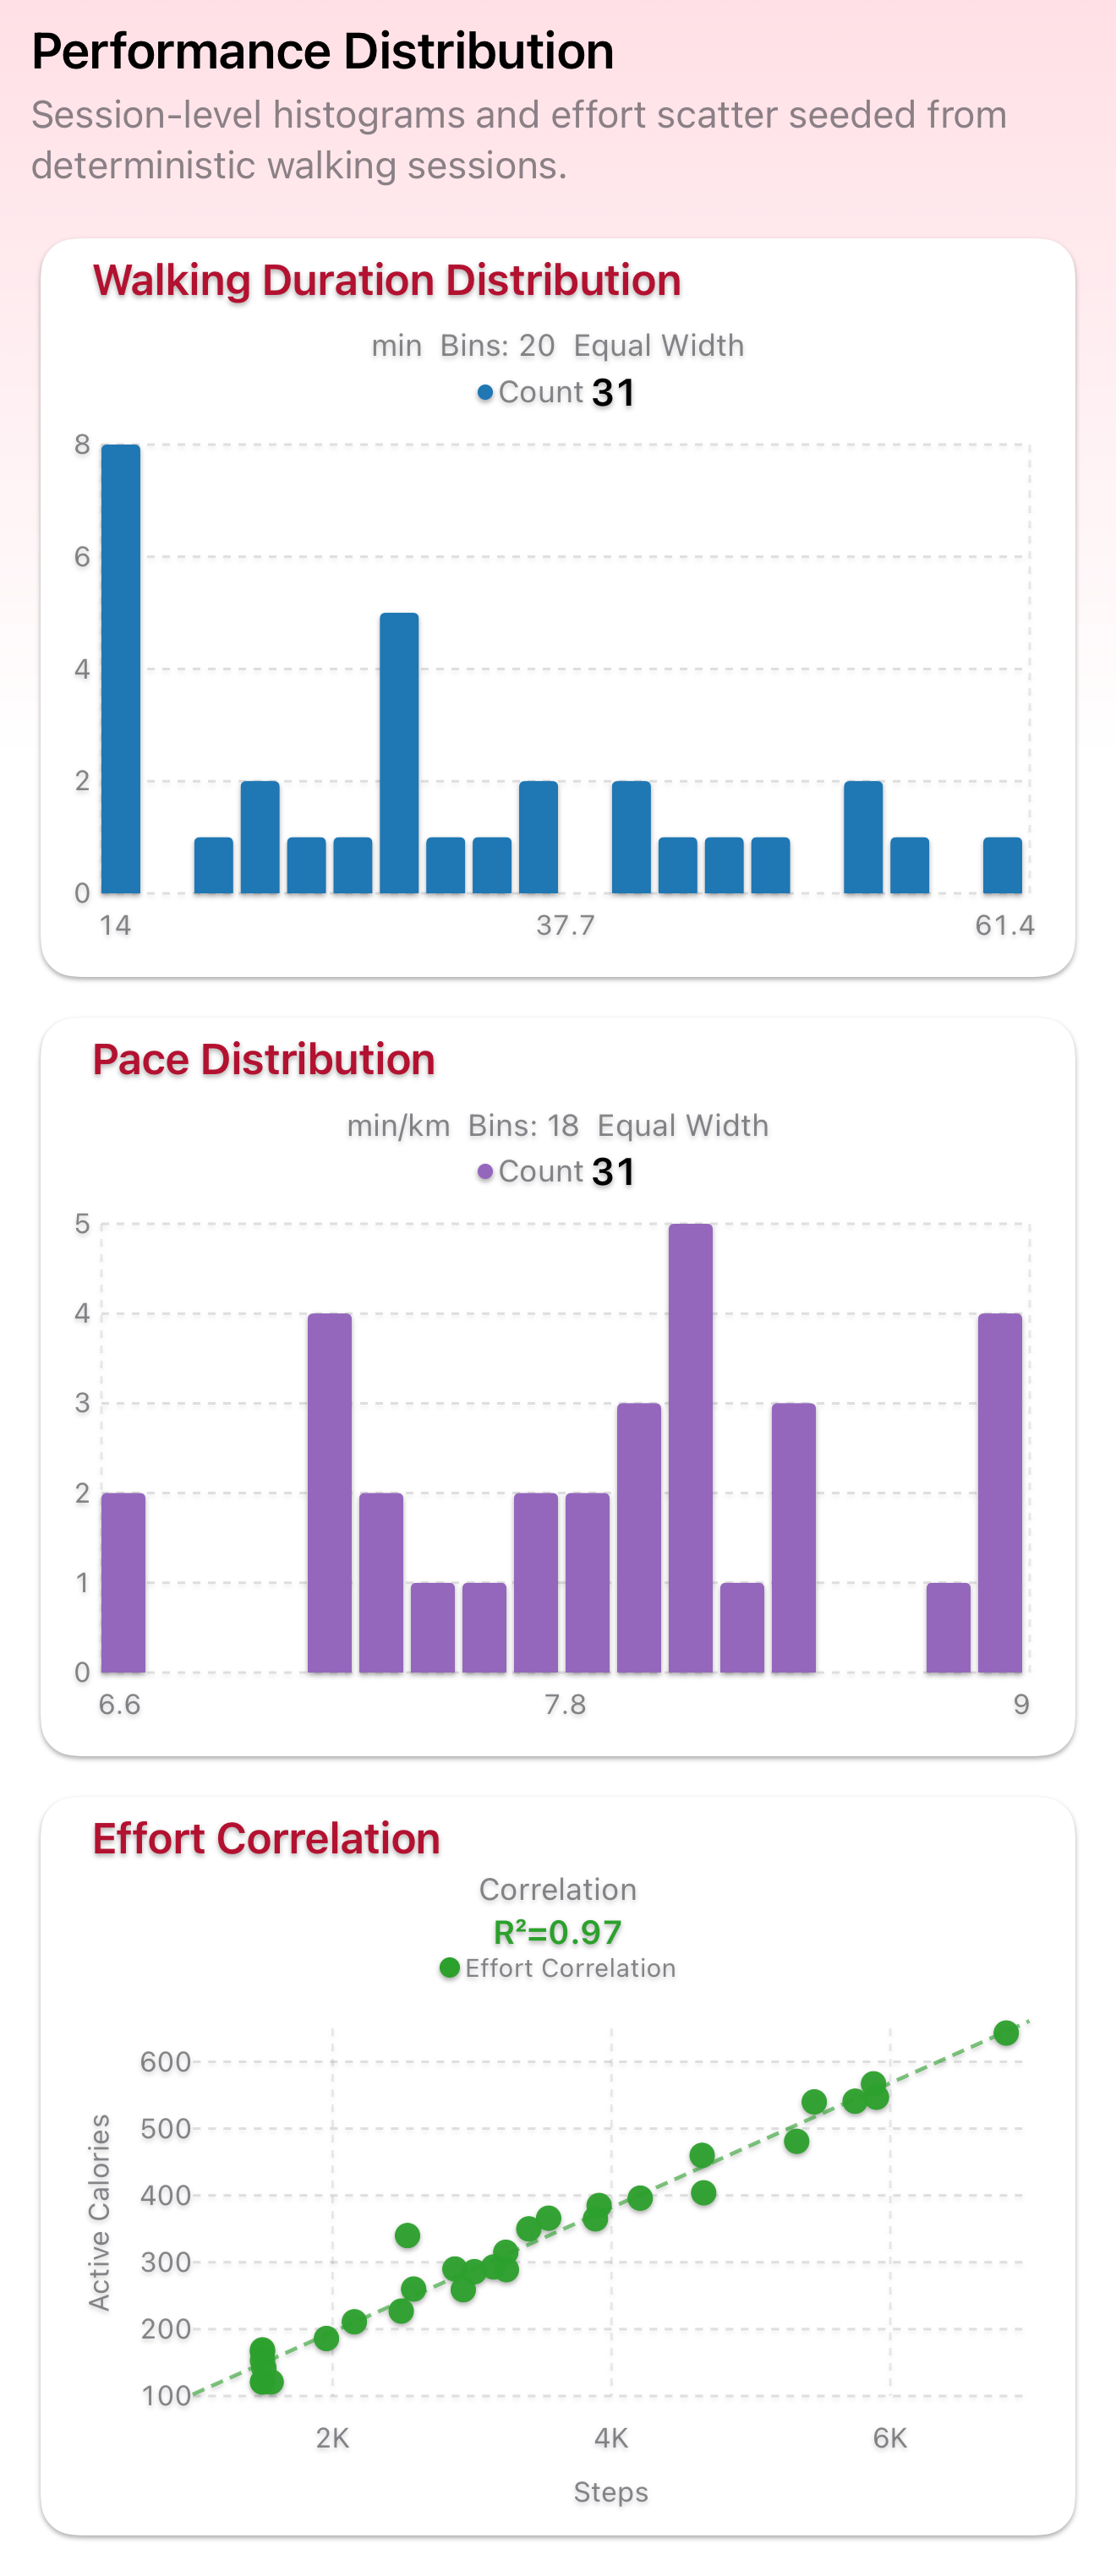
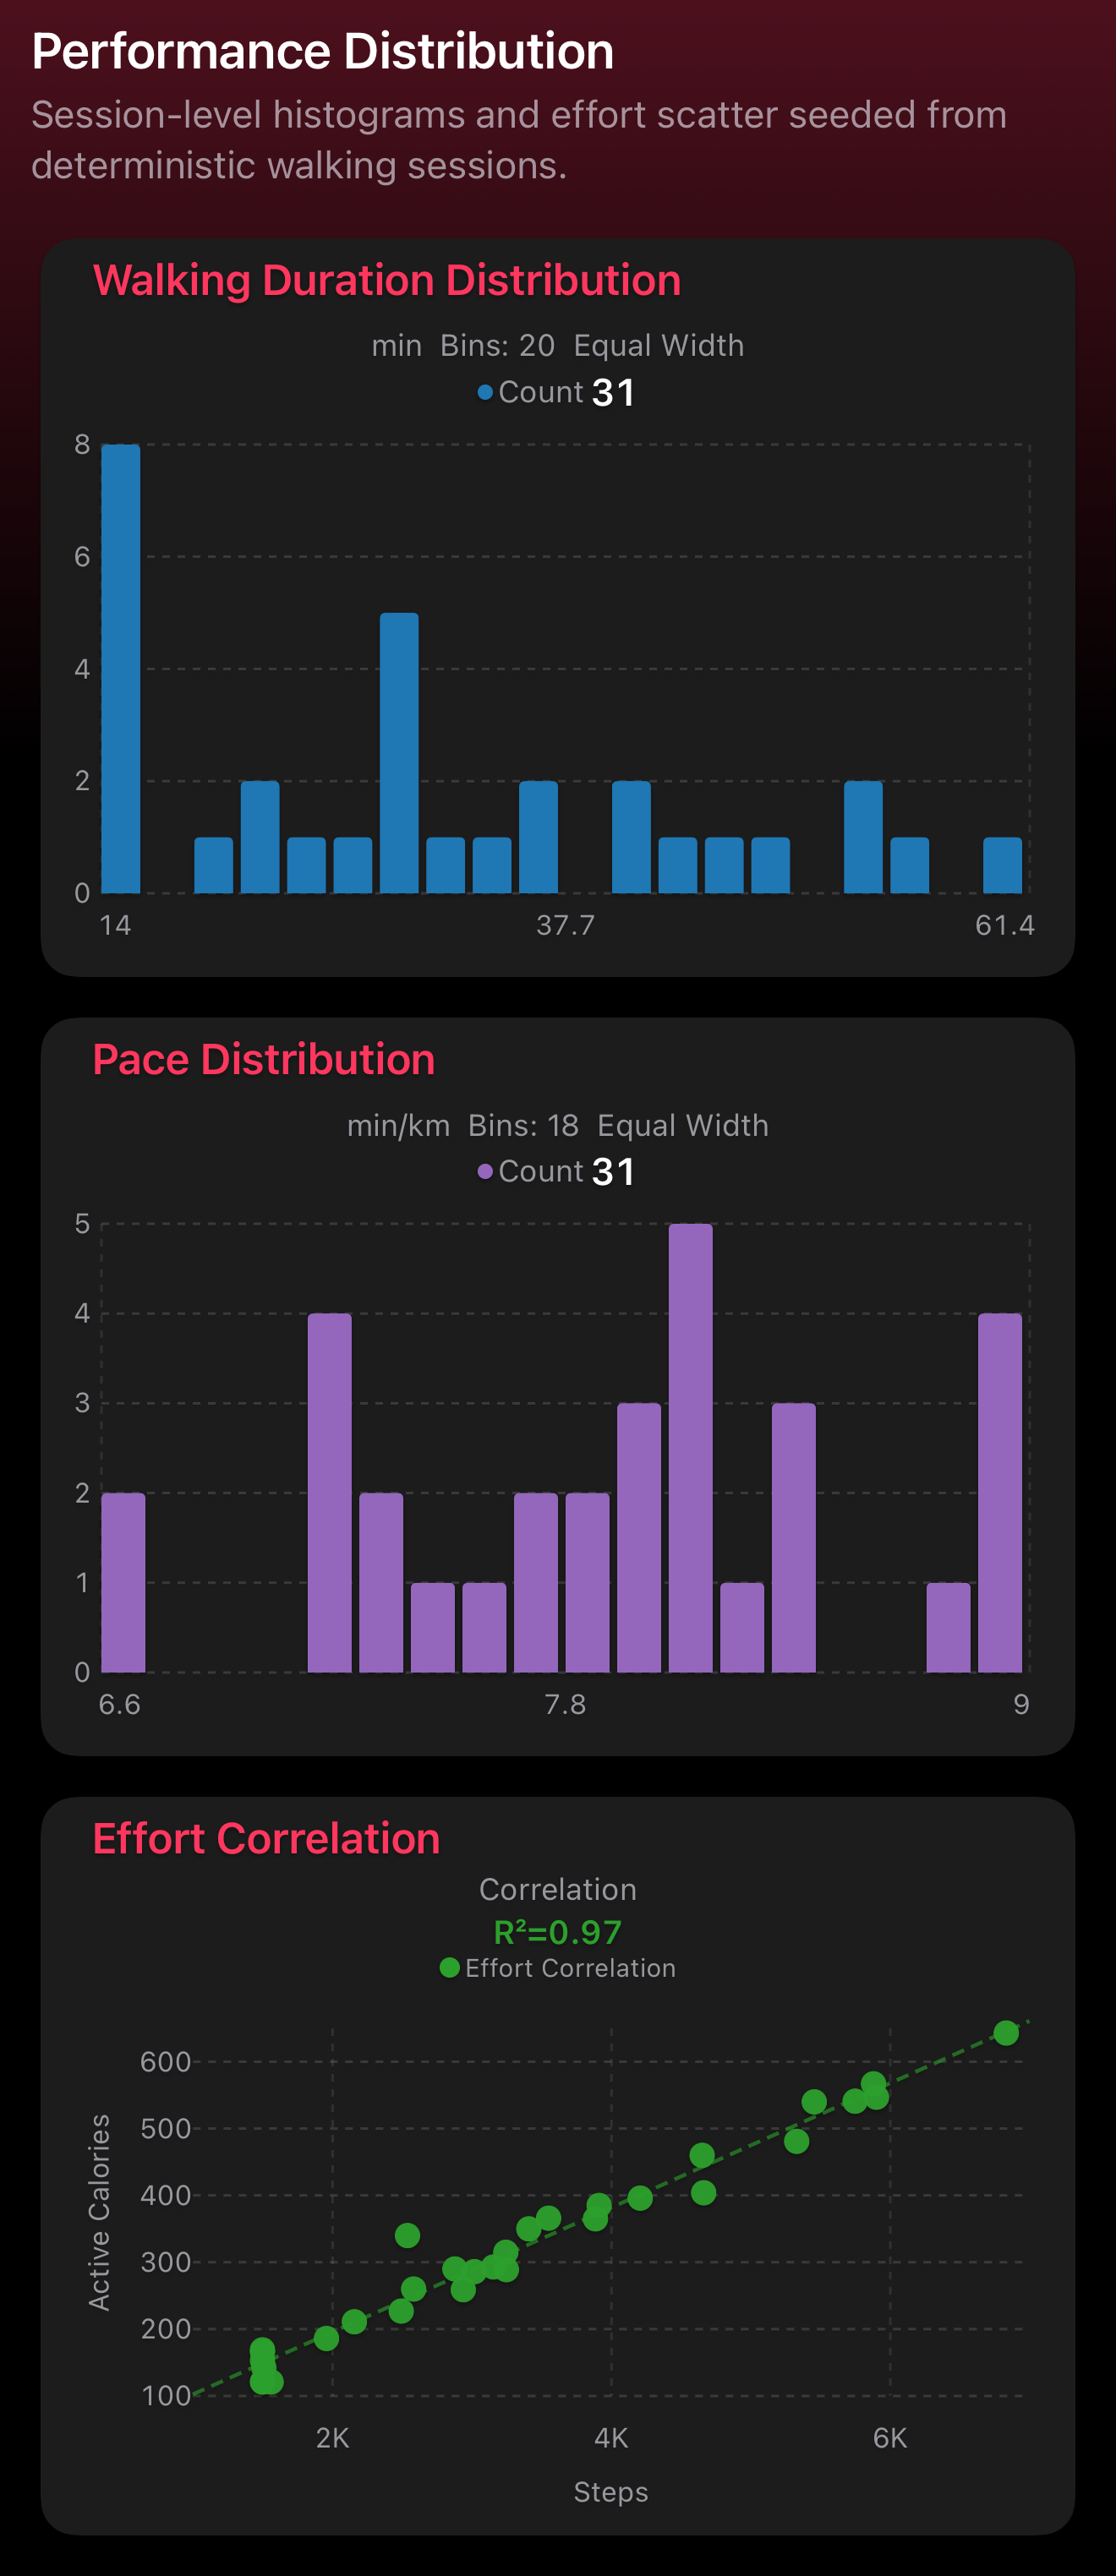
A performance-focused dashboard for recent running sessions.

Running Performance Lab dashboard preview Running Performance Lab dashboard preview

Running Performance Lab

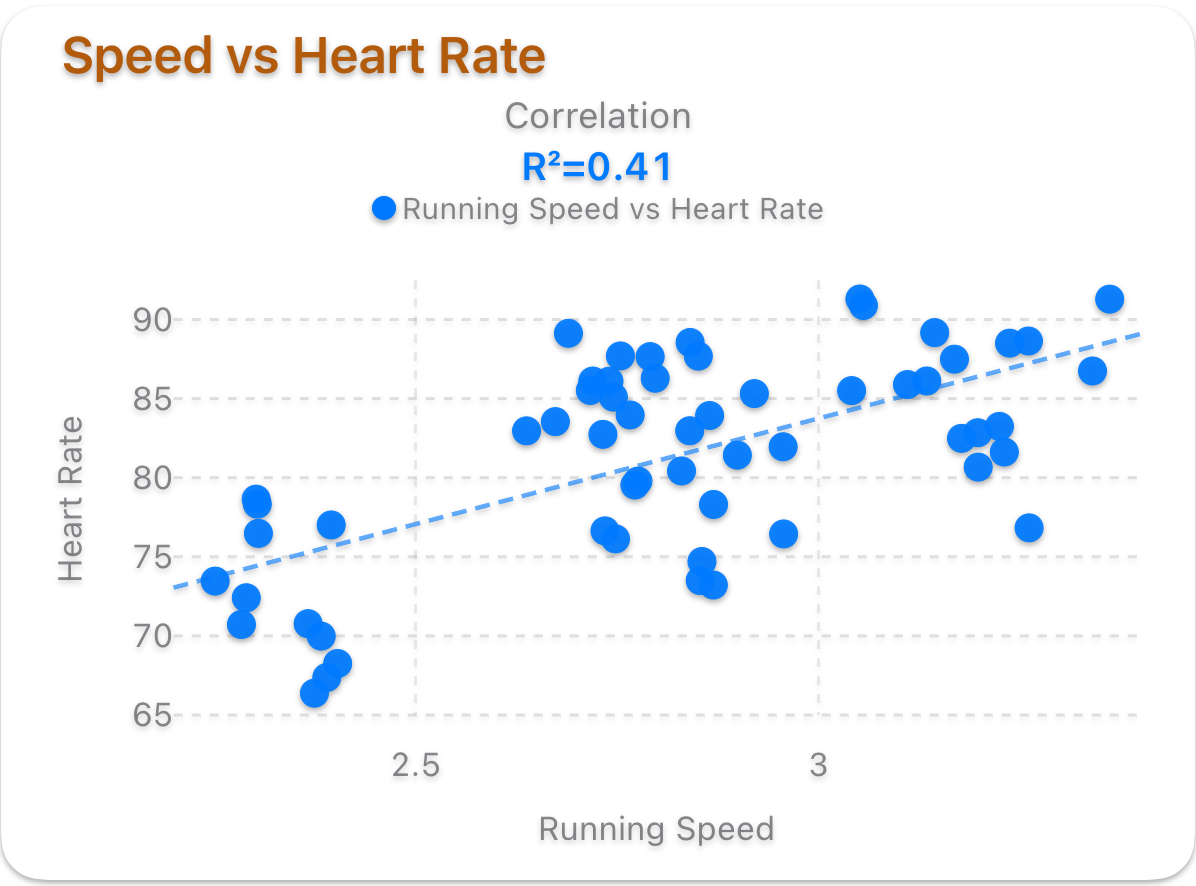
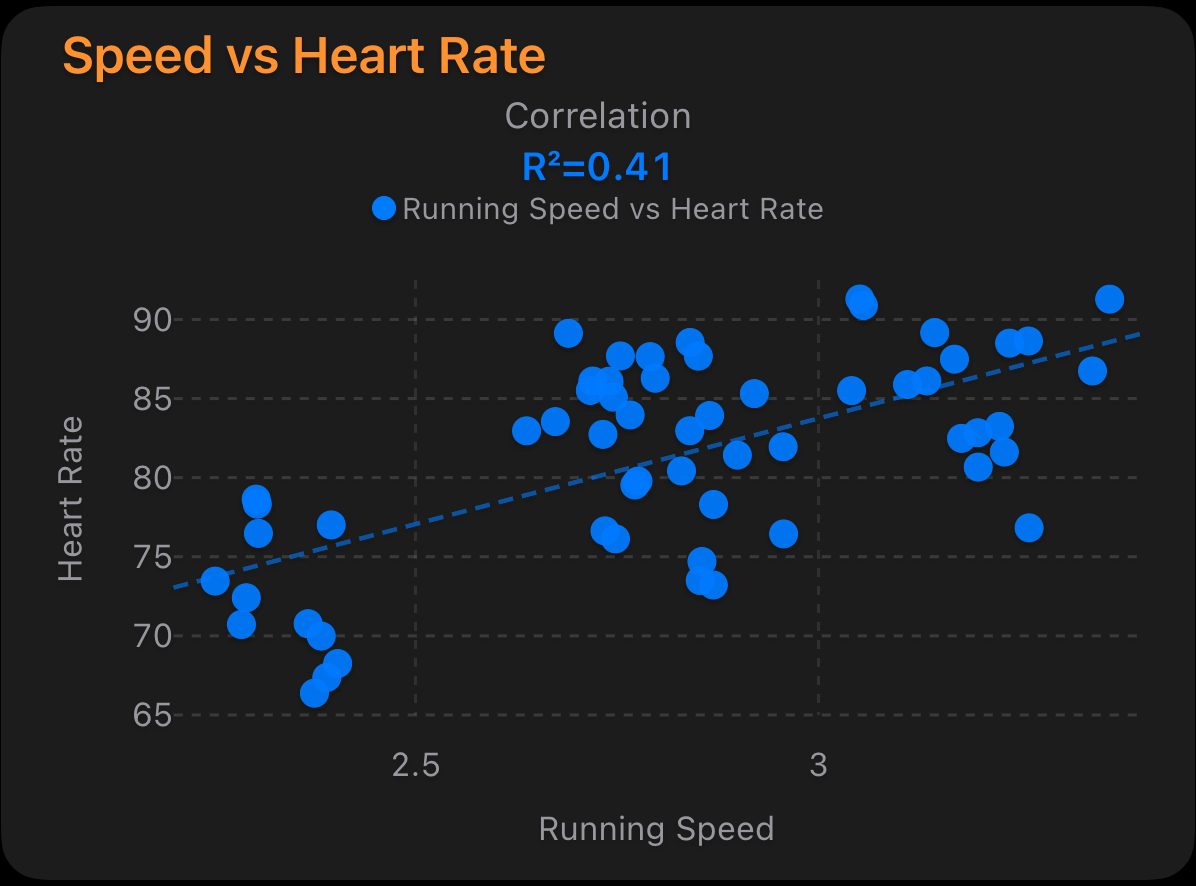
Speed, heart rate, and stride correlations.

Yield Regimes

A long-horizon rates dashboard for curve shape, spreads, and z-scores.

Yield Regimes dashboard preview Yield Regimes dashboard preview

Yield Regimes

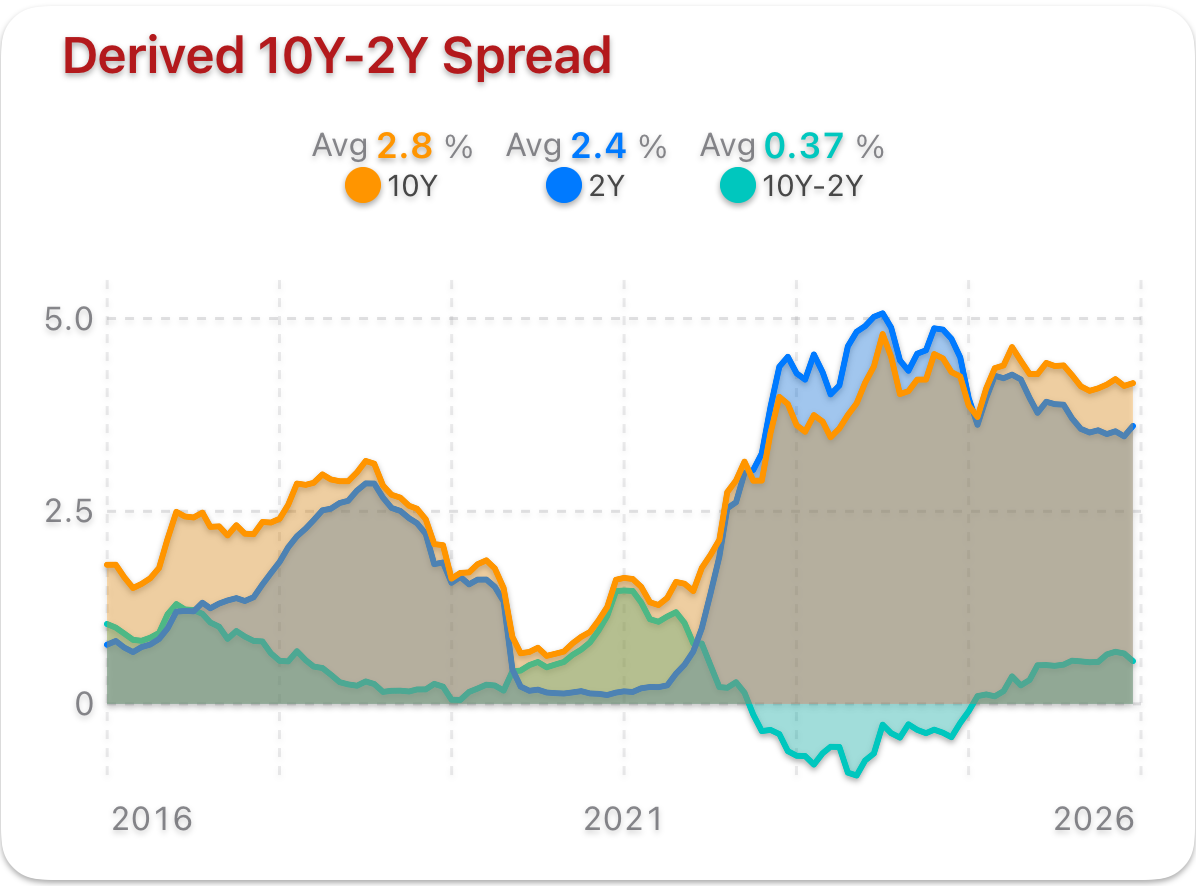
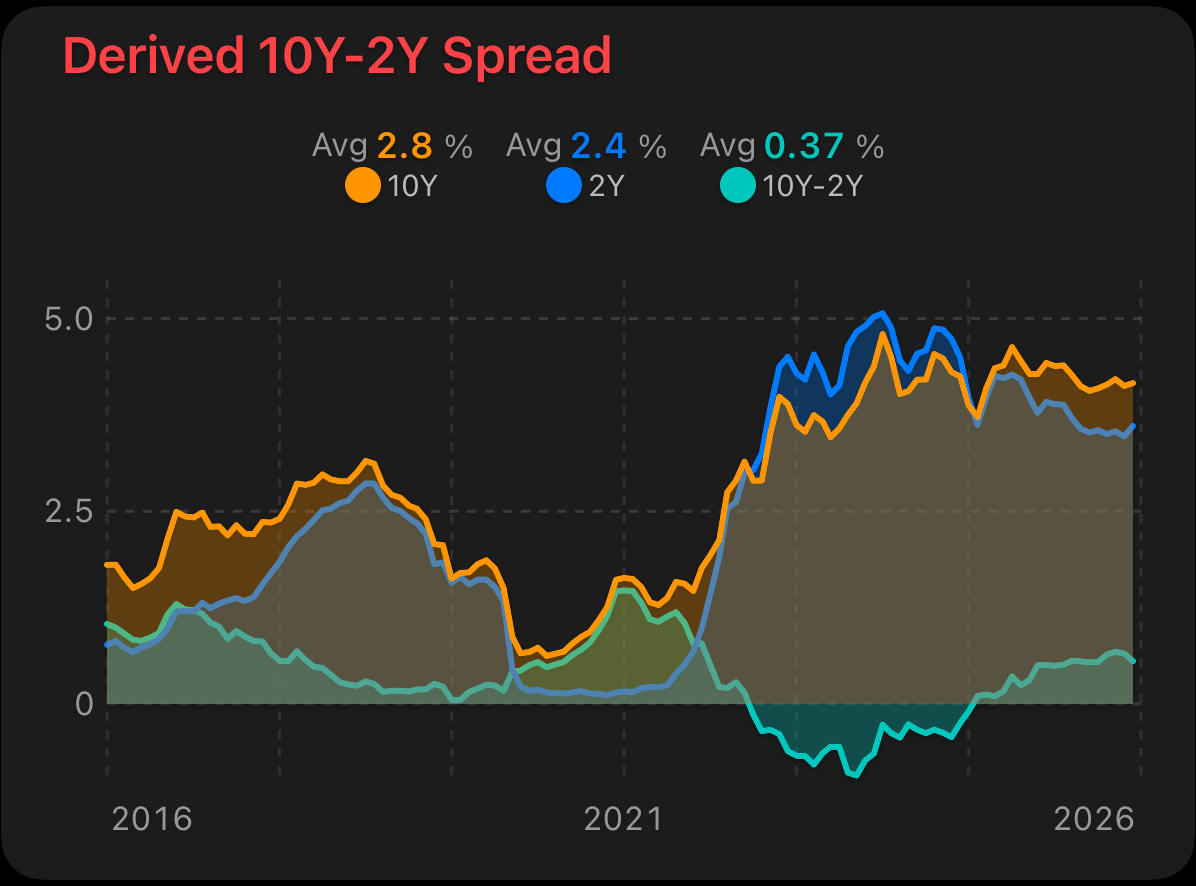
Treasury yields, spreads, and regime shifts.

Weather Activity Atlas

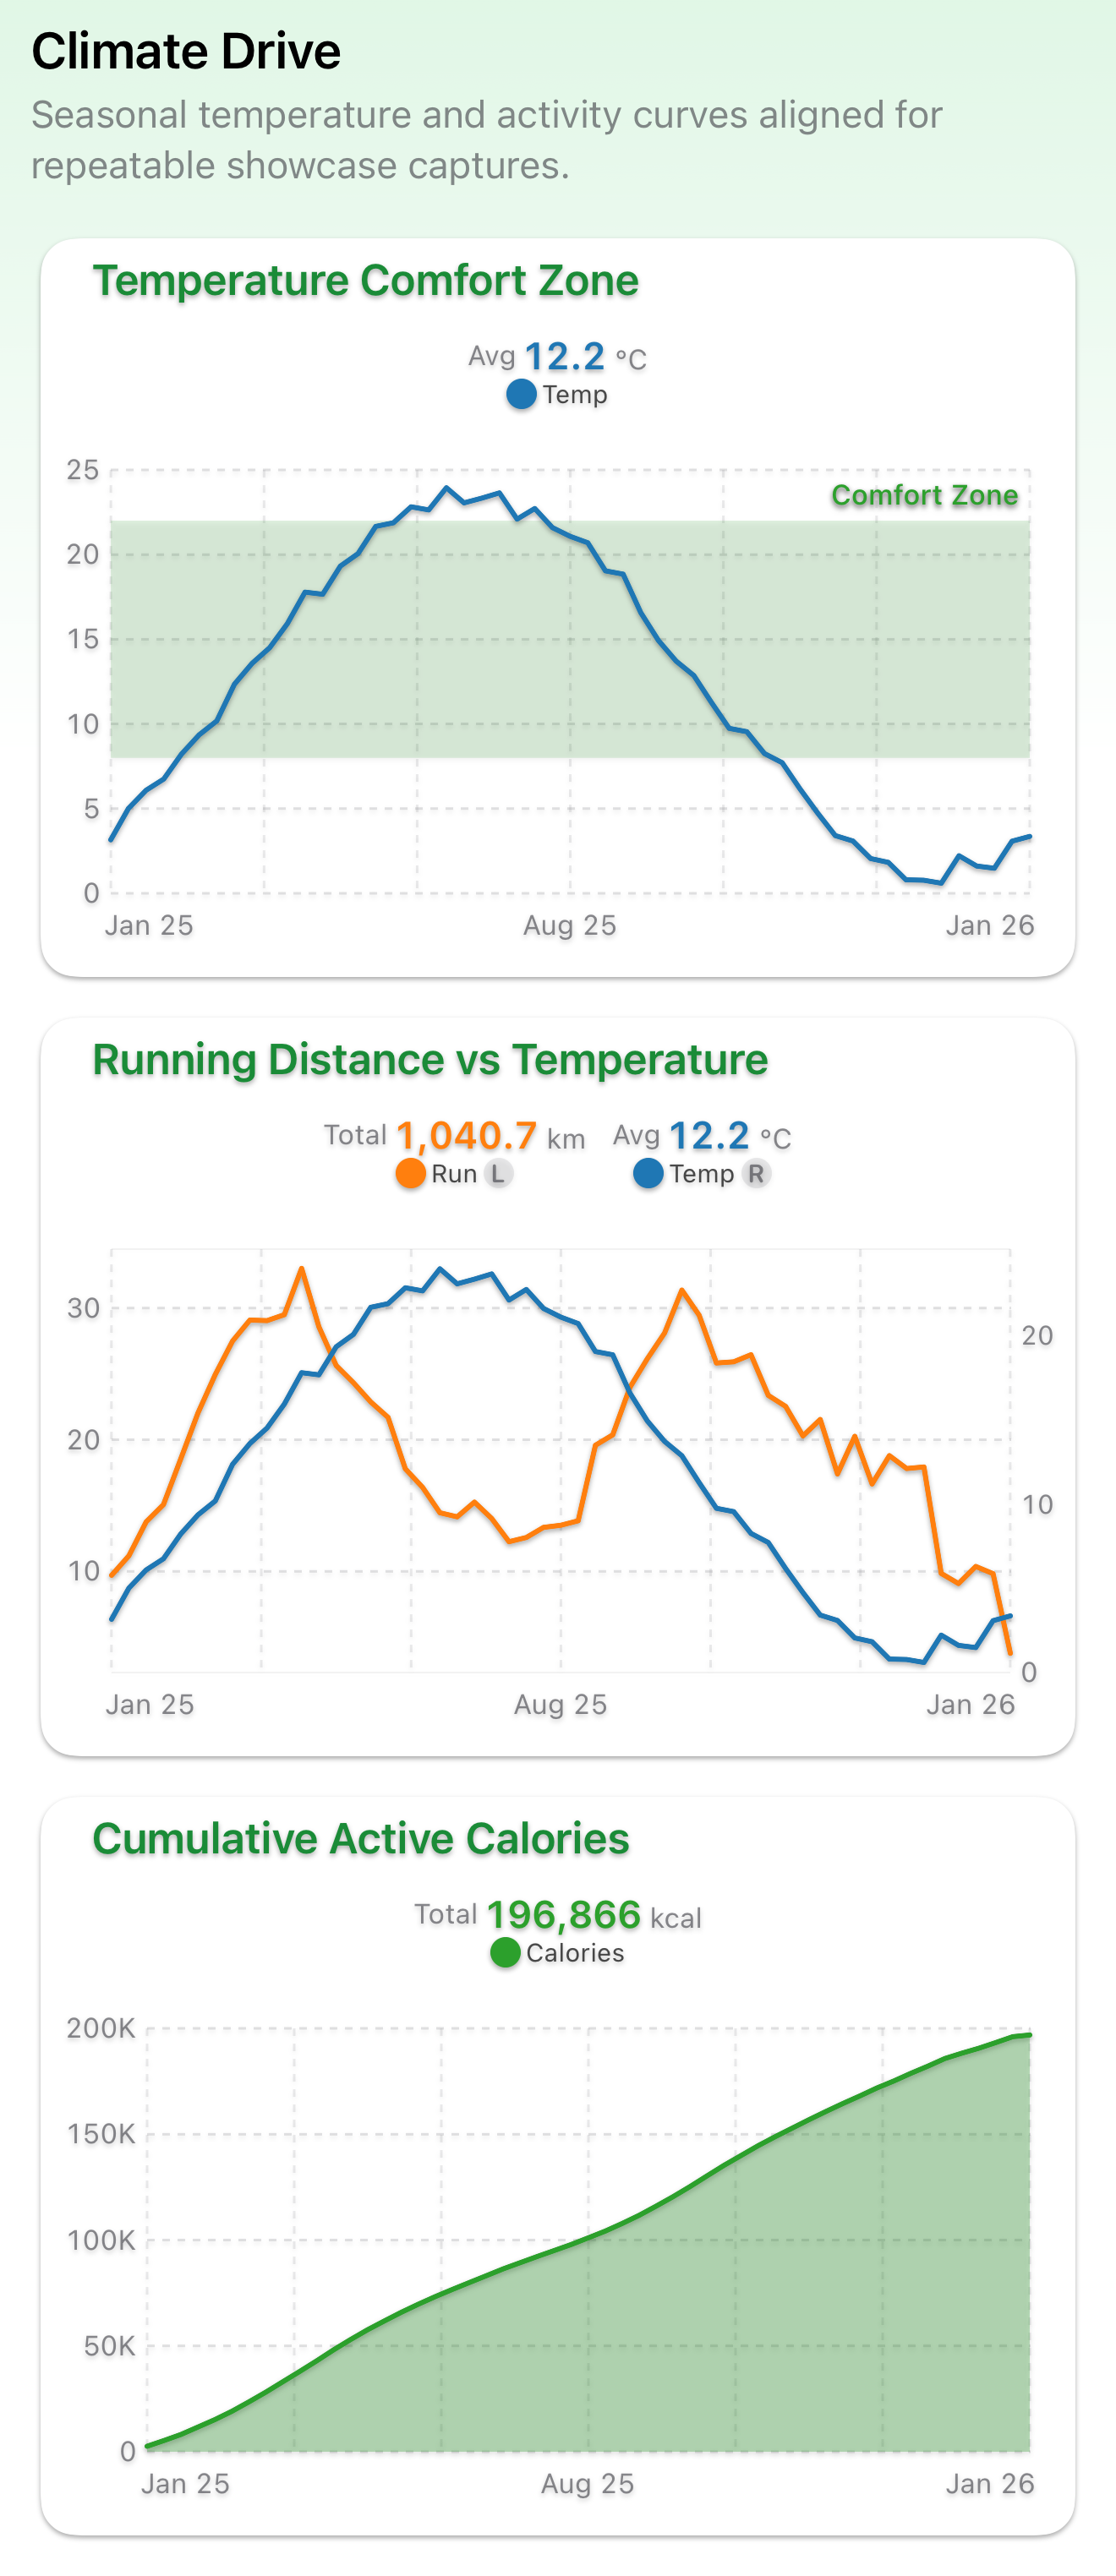
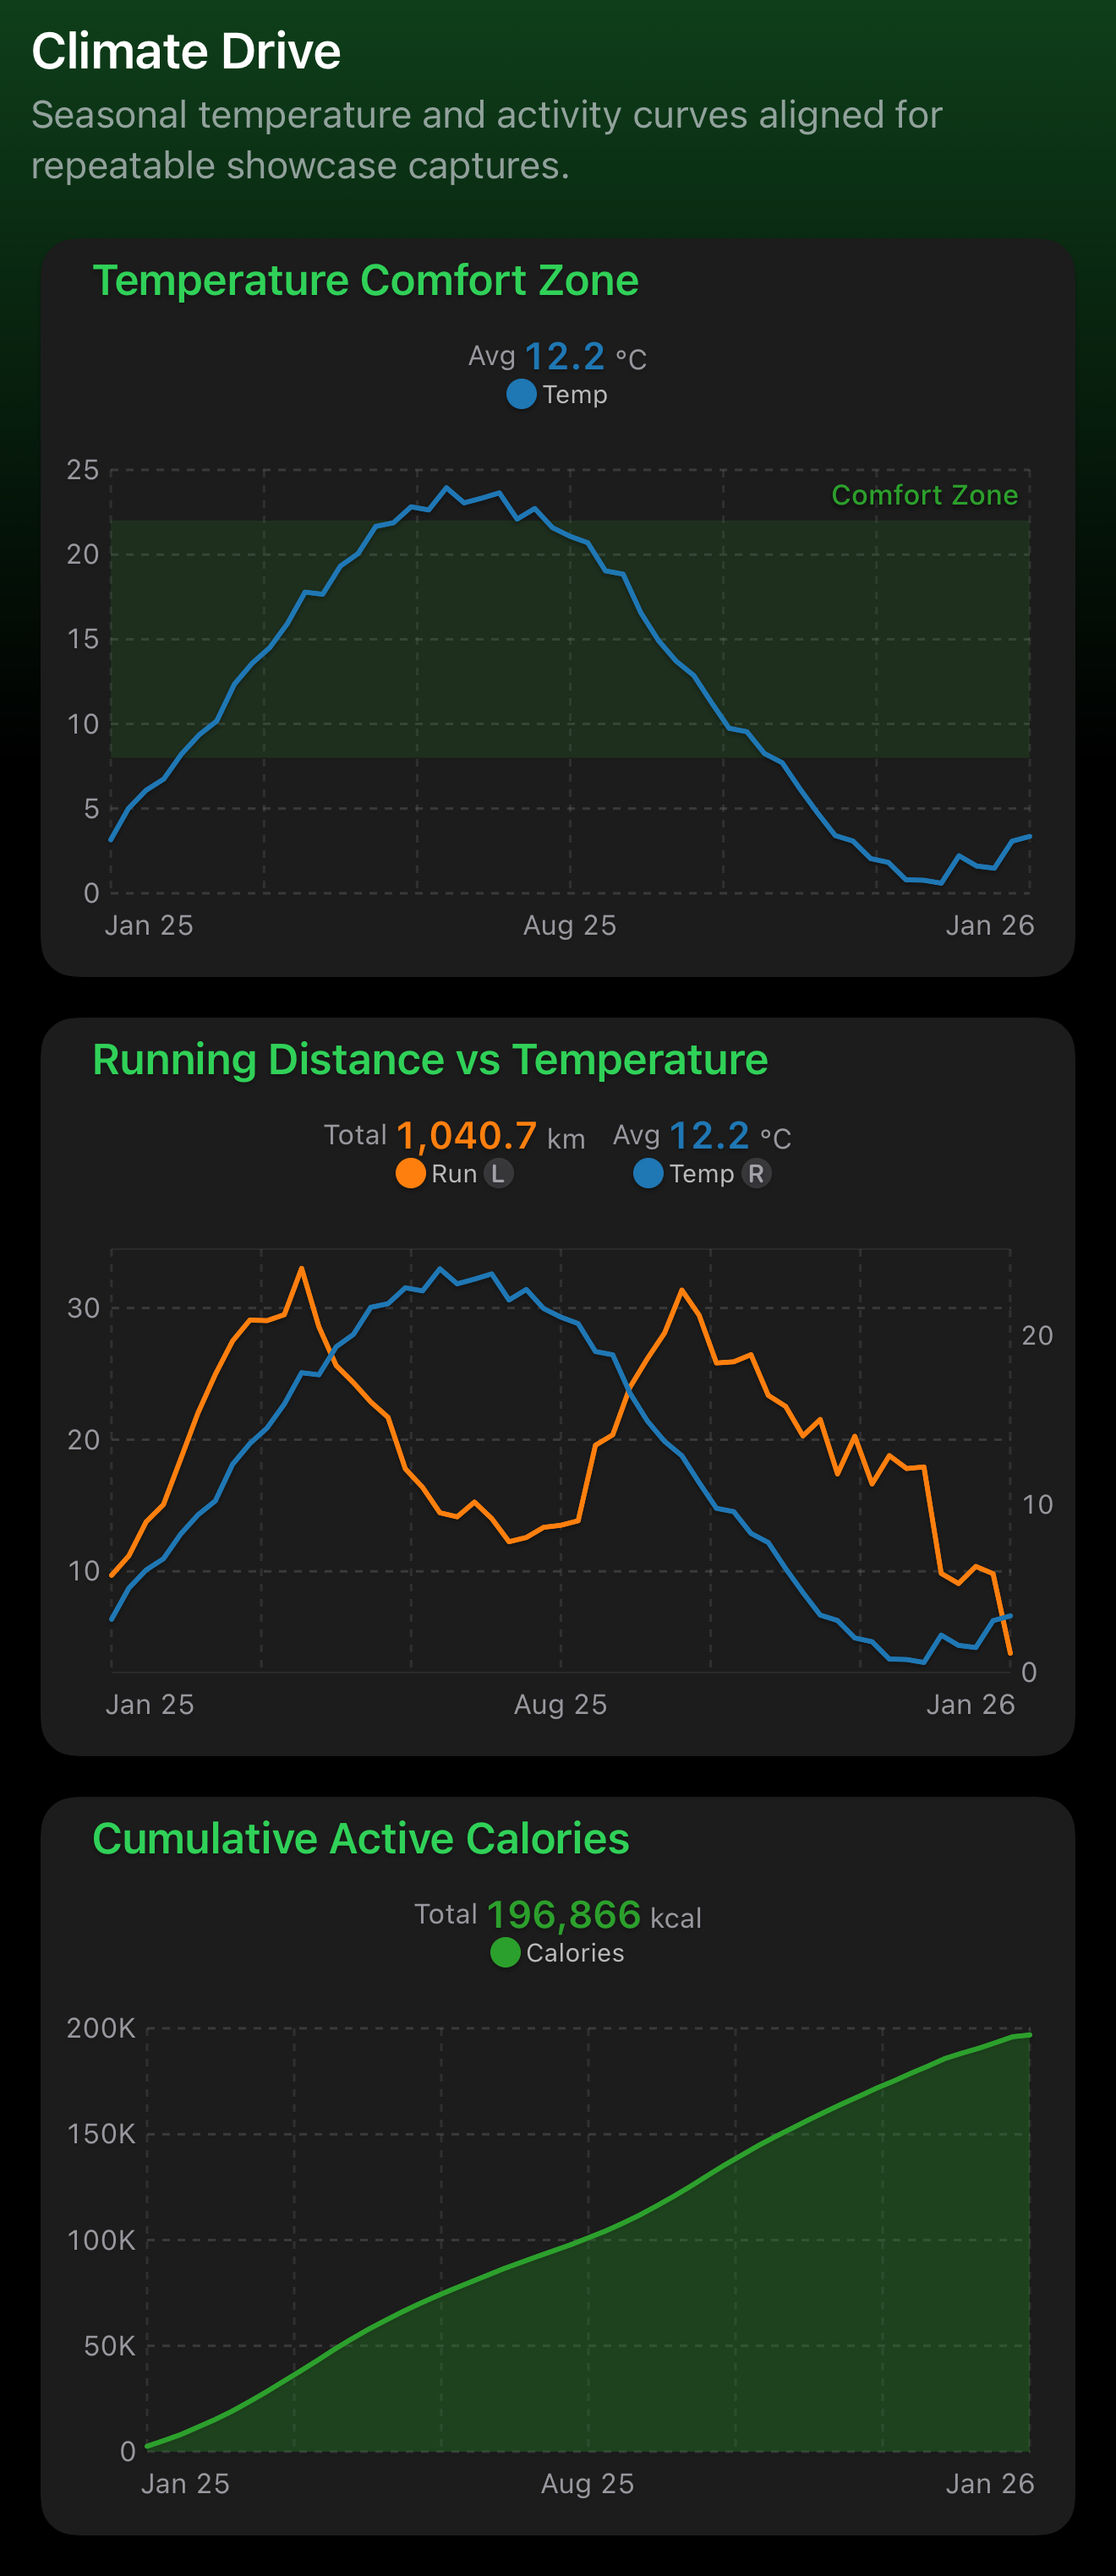
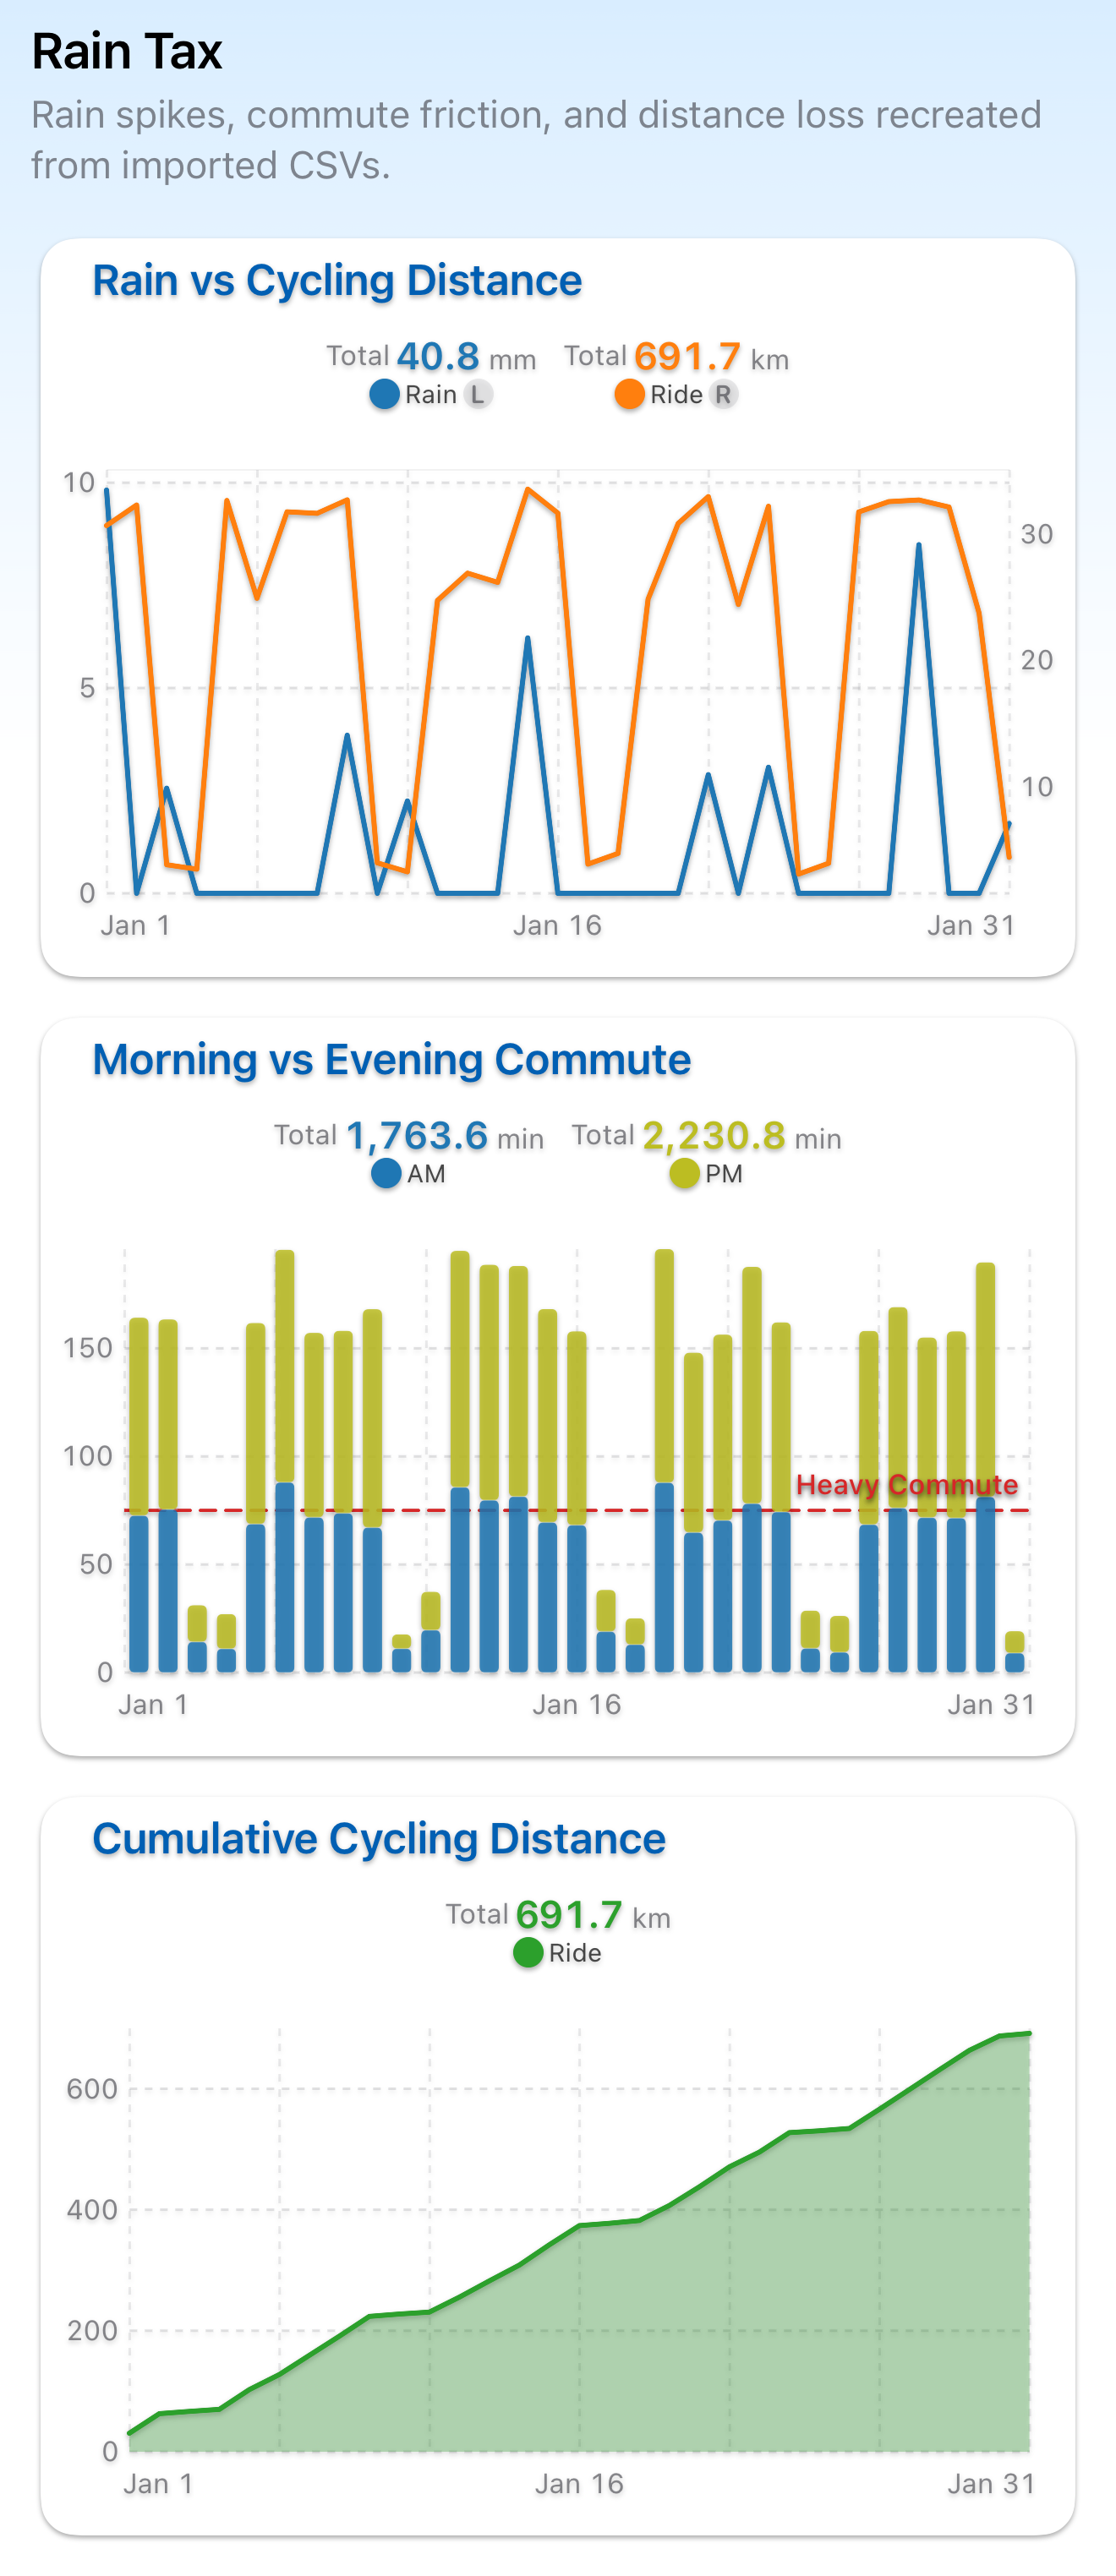
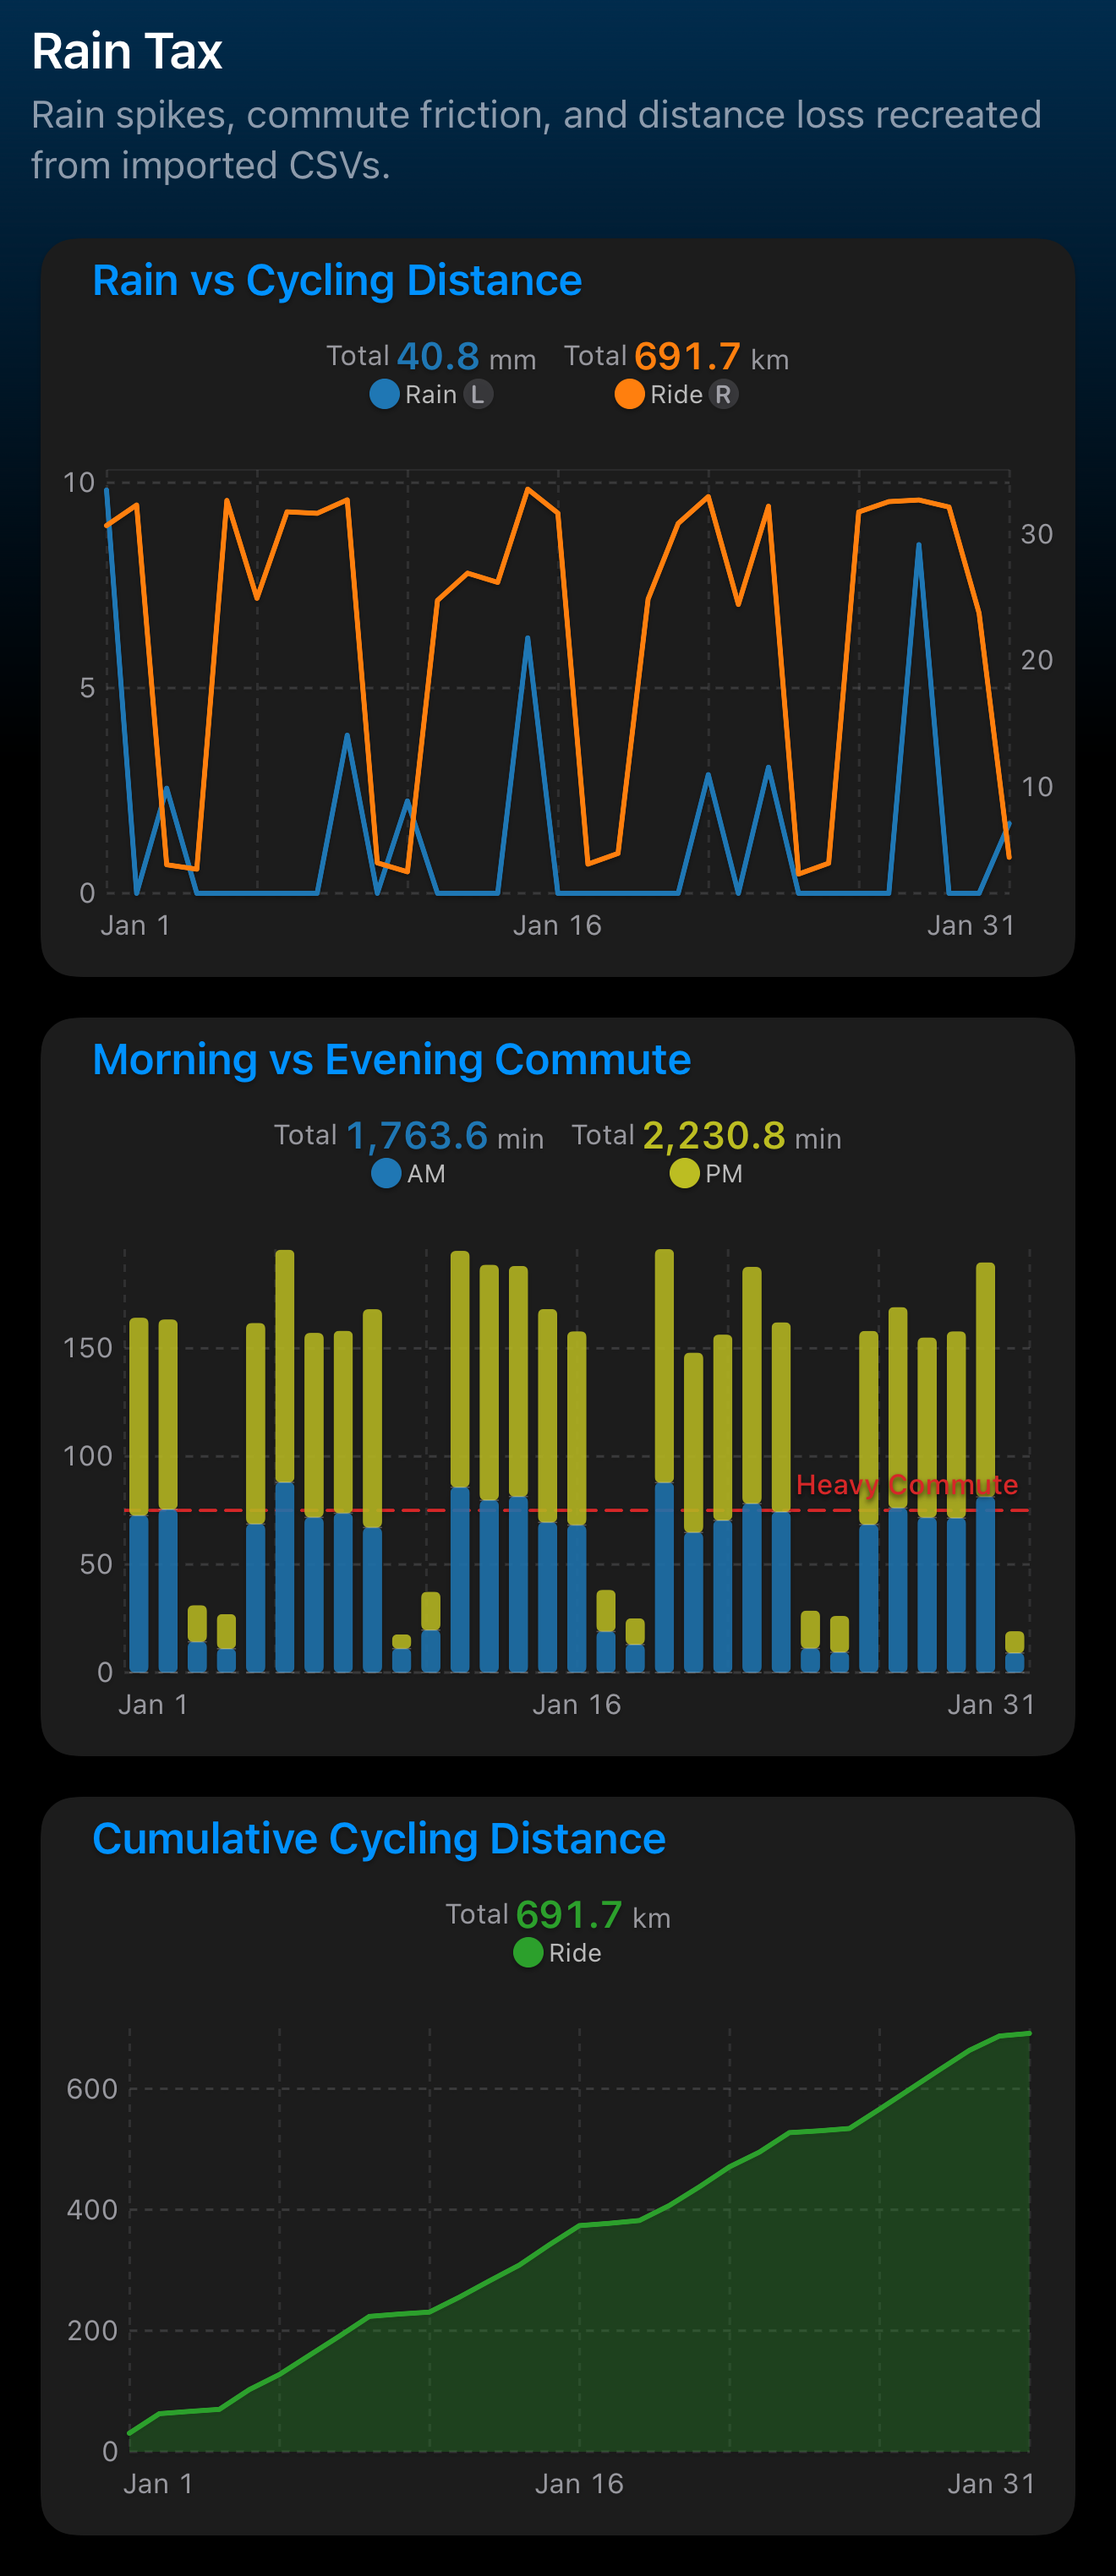
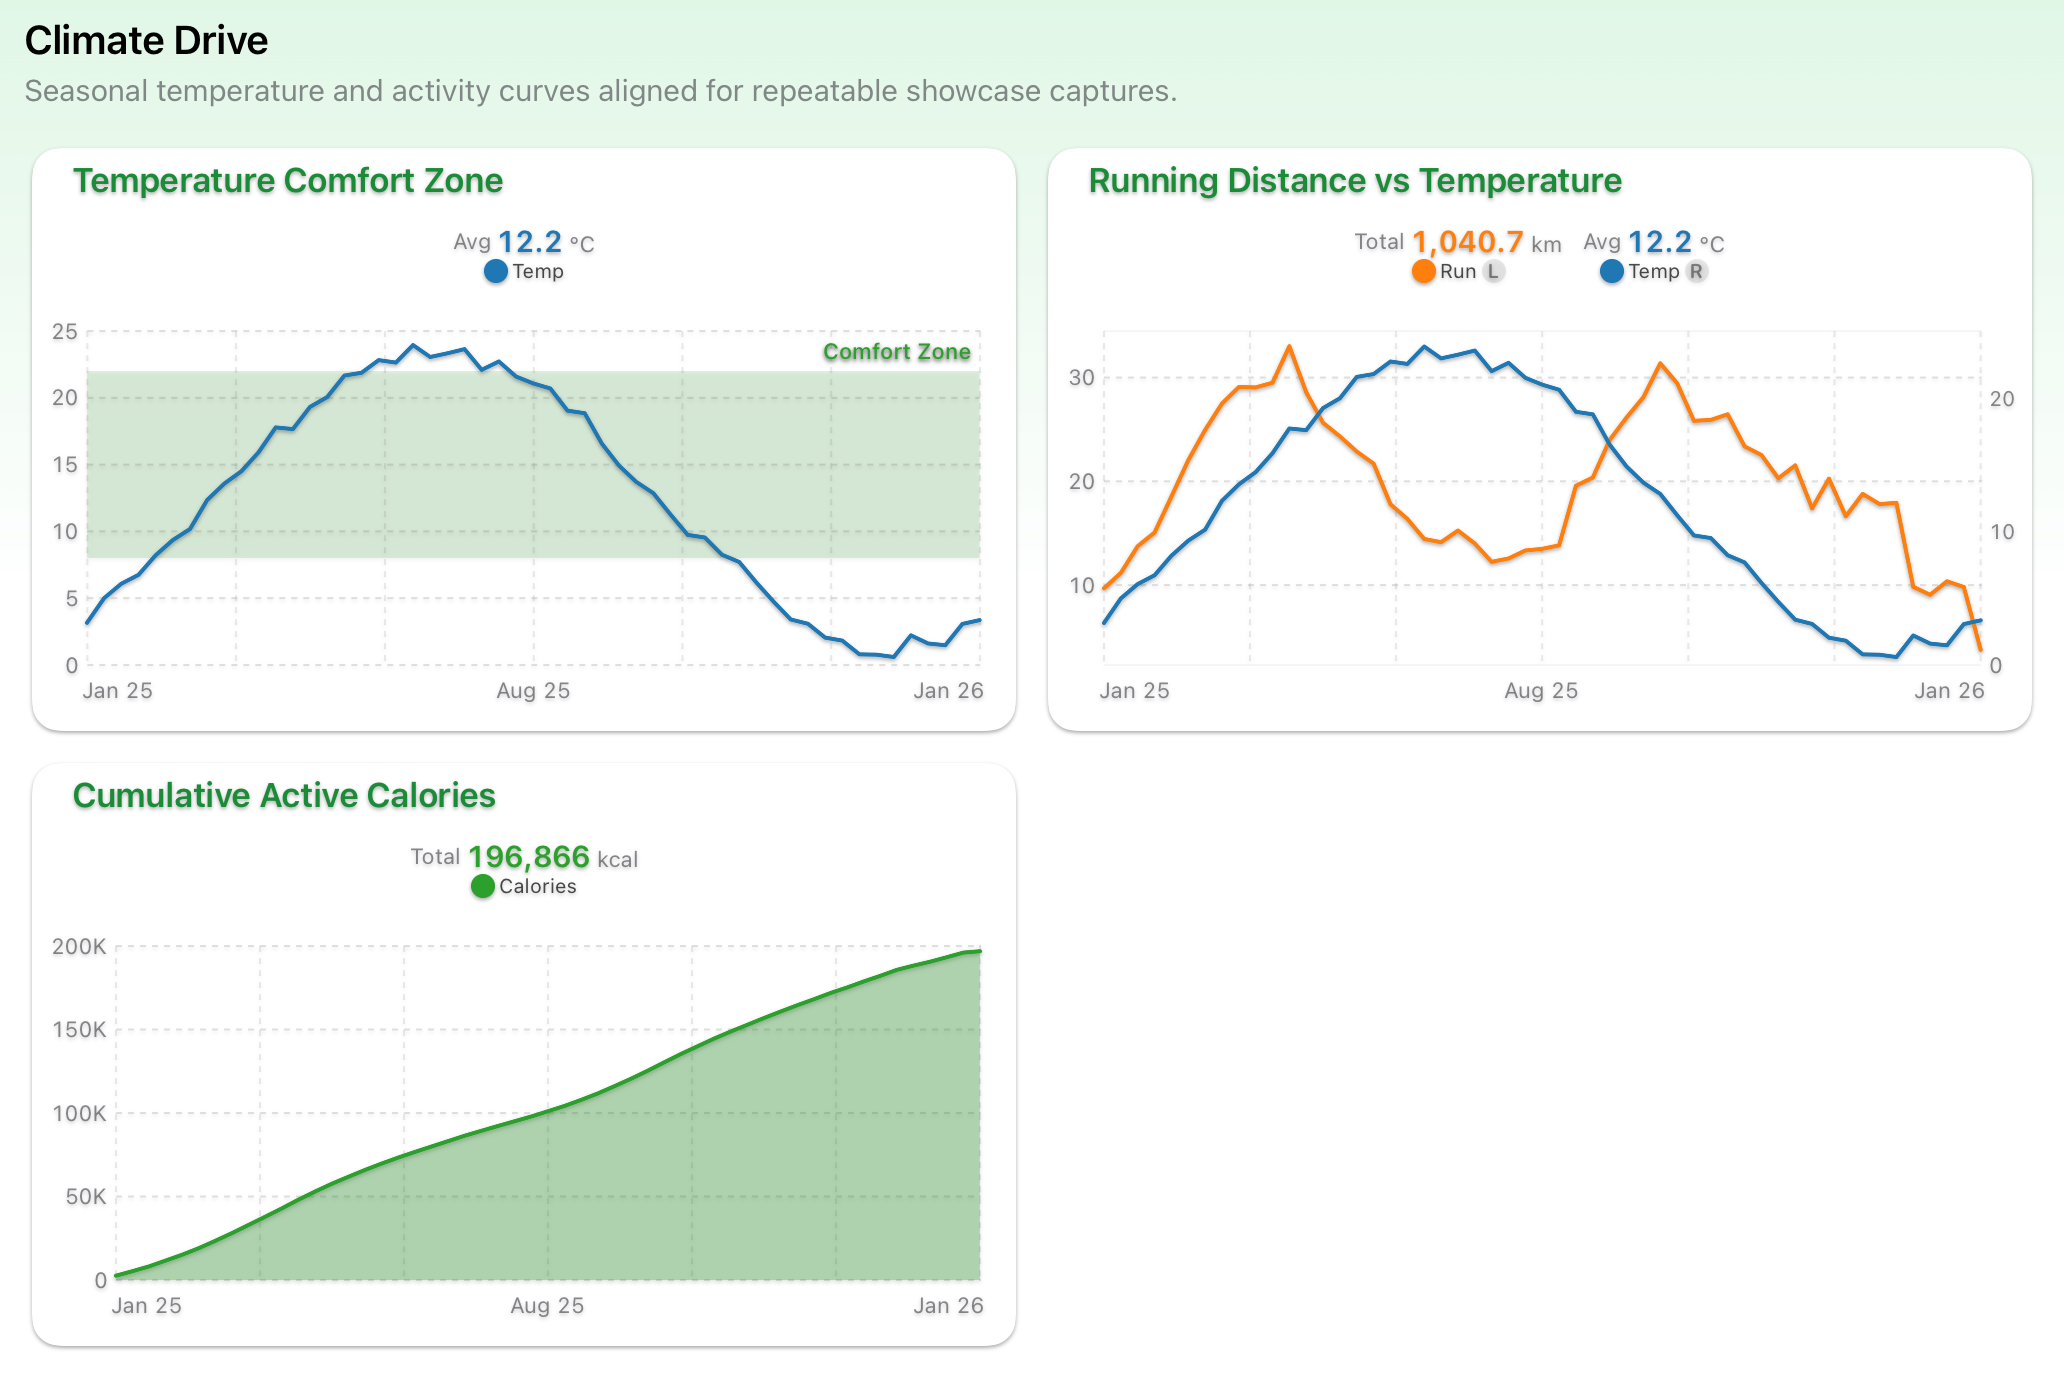
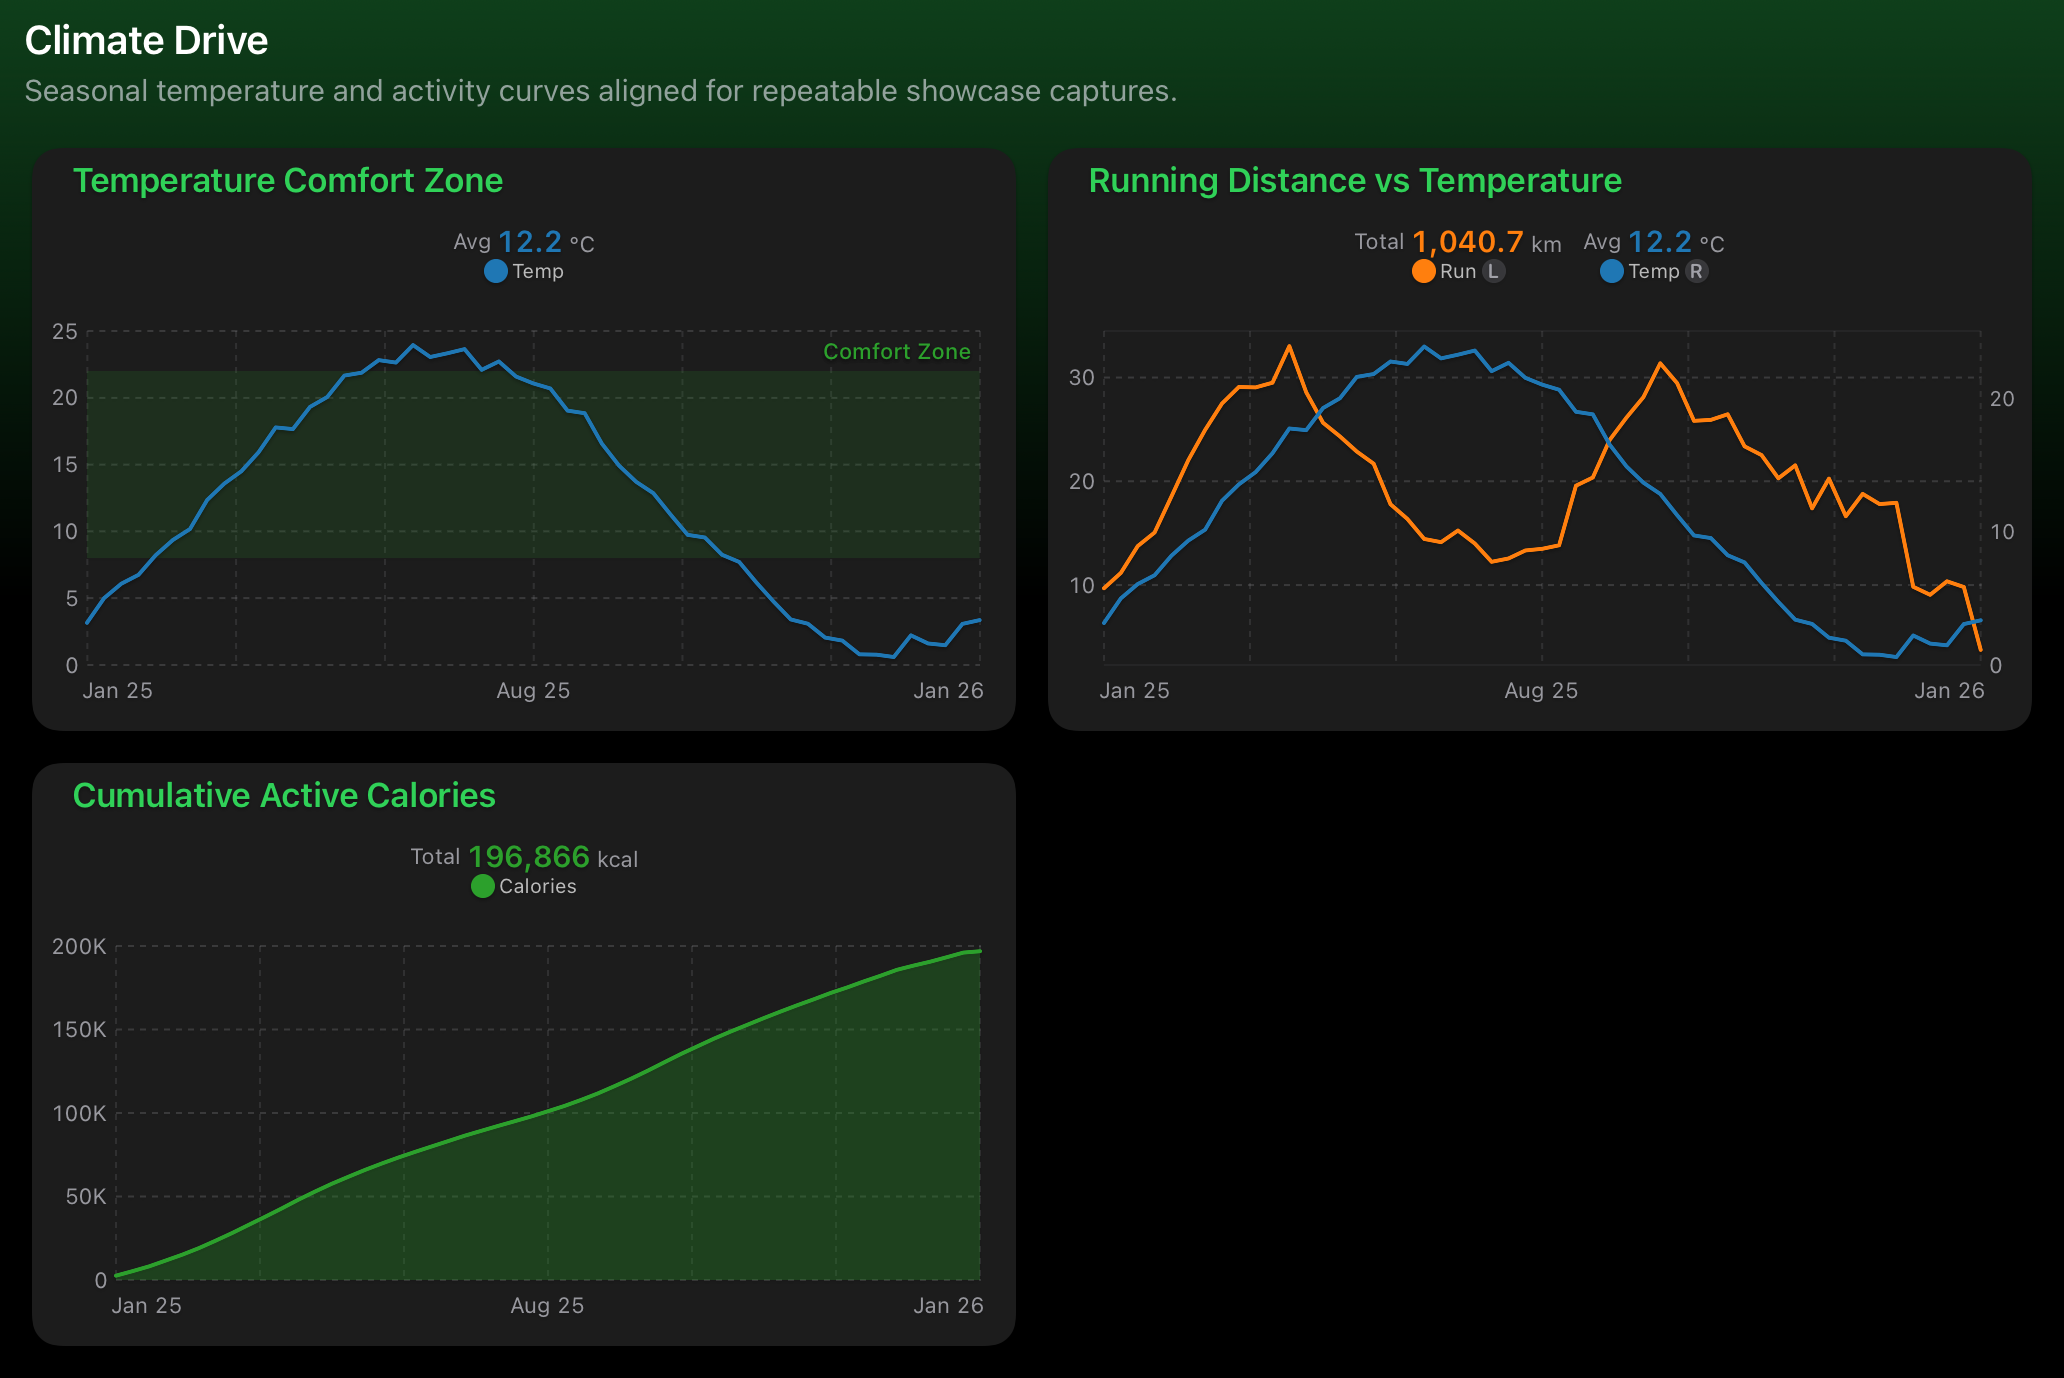
See whether local conditions shift how much you move over time.

Weather Activity Atlas dashboard preview Weather Activity Atlas dashboard preview

Weather Activity Atlas

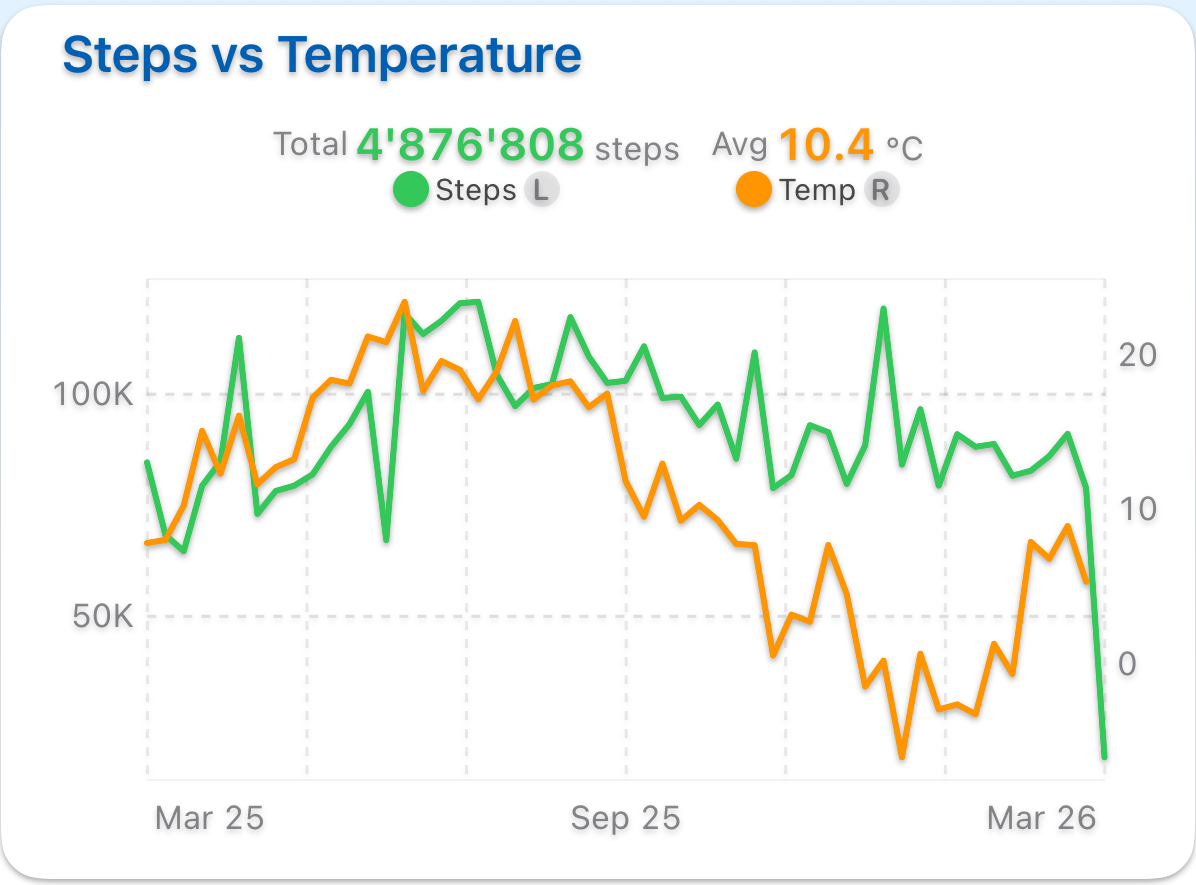
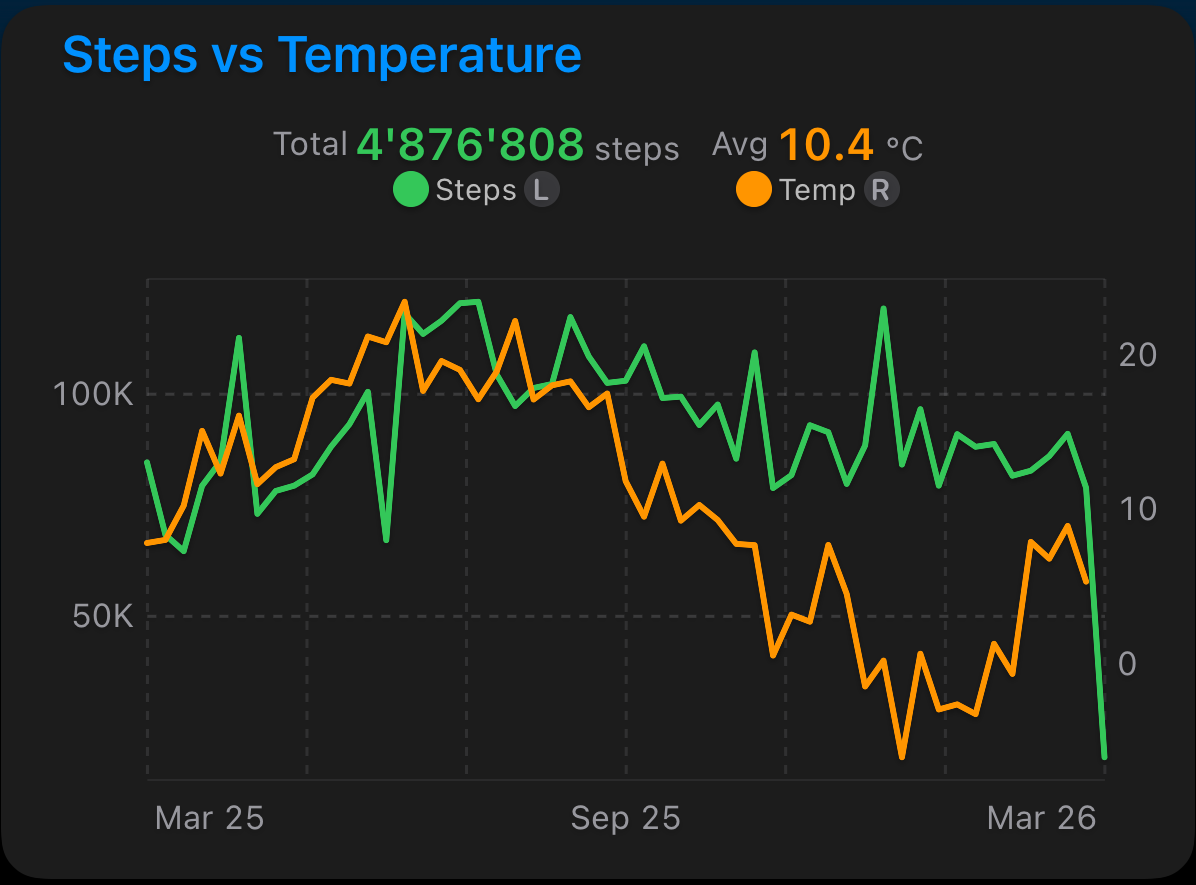
Steps and temperature patterns across seasons.

Lunar Sleep Snapshot

A simple month-long look at sleep and moon illumination.

Lunar Sleep Snapshot dashboard preview Lunar Sleep Snapshot dashboard preview

Lunar Sleep Snapshot

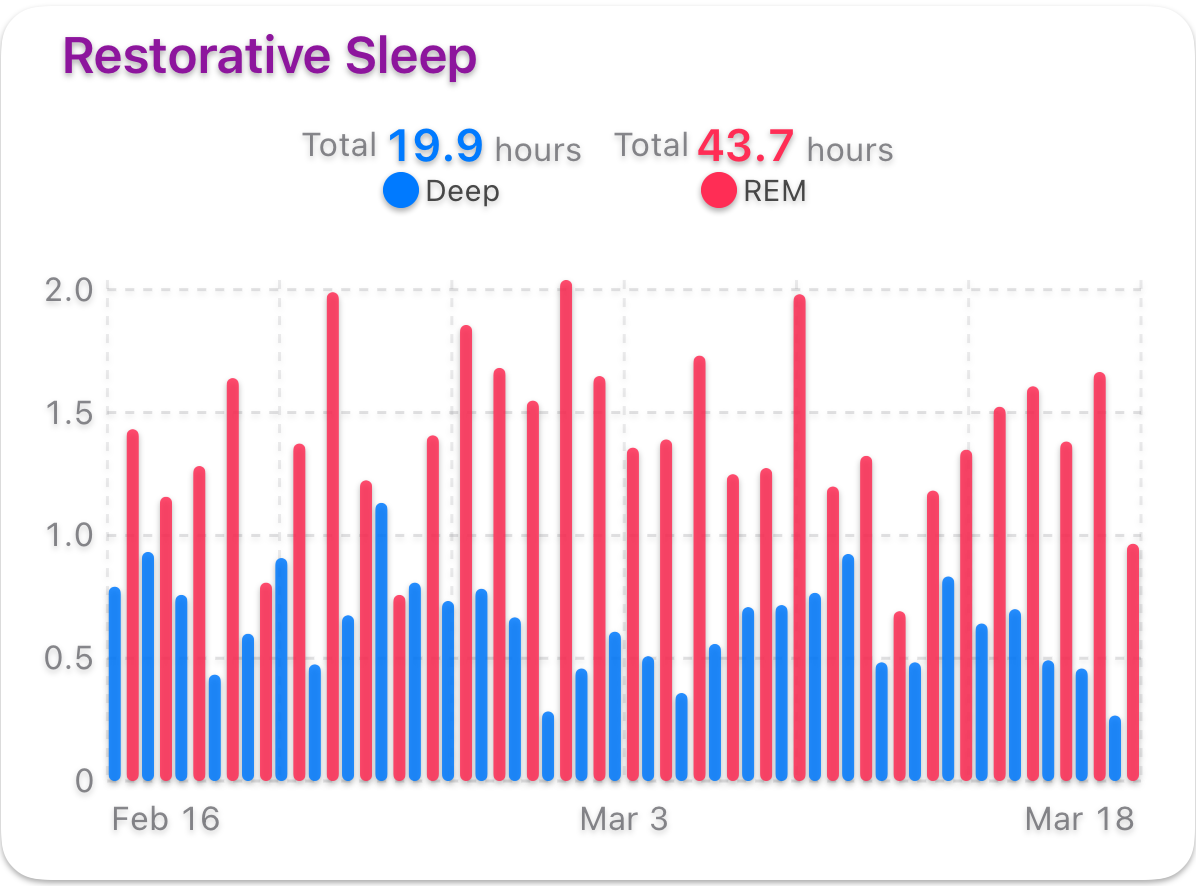
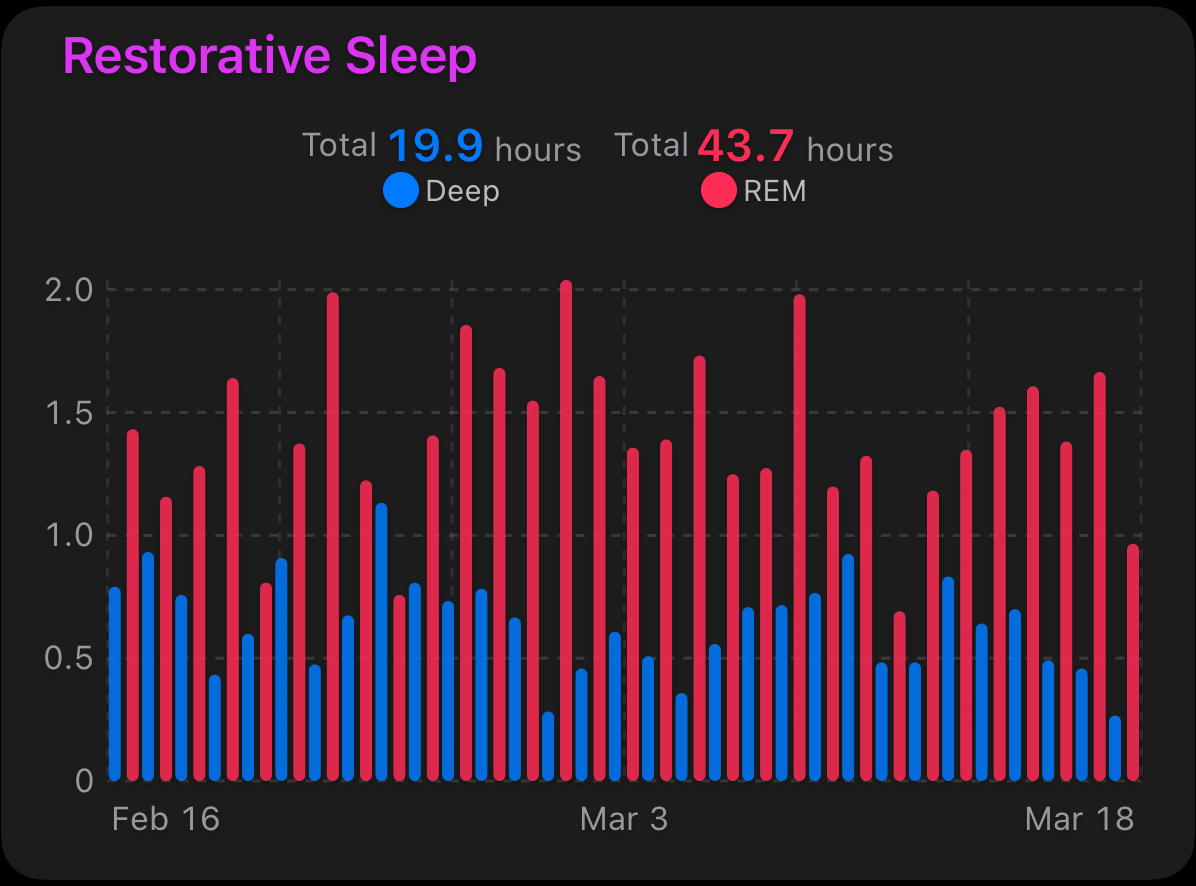
Deep and REM sleep side by side, night after night.

Discover what drives your trends

Most dashboards show you what happened. VoilàSense helps you understand why.

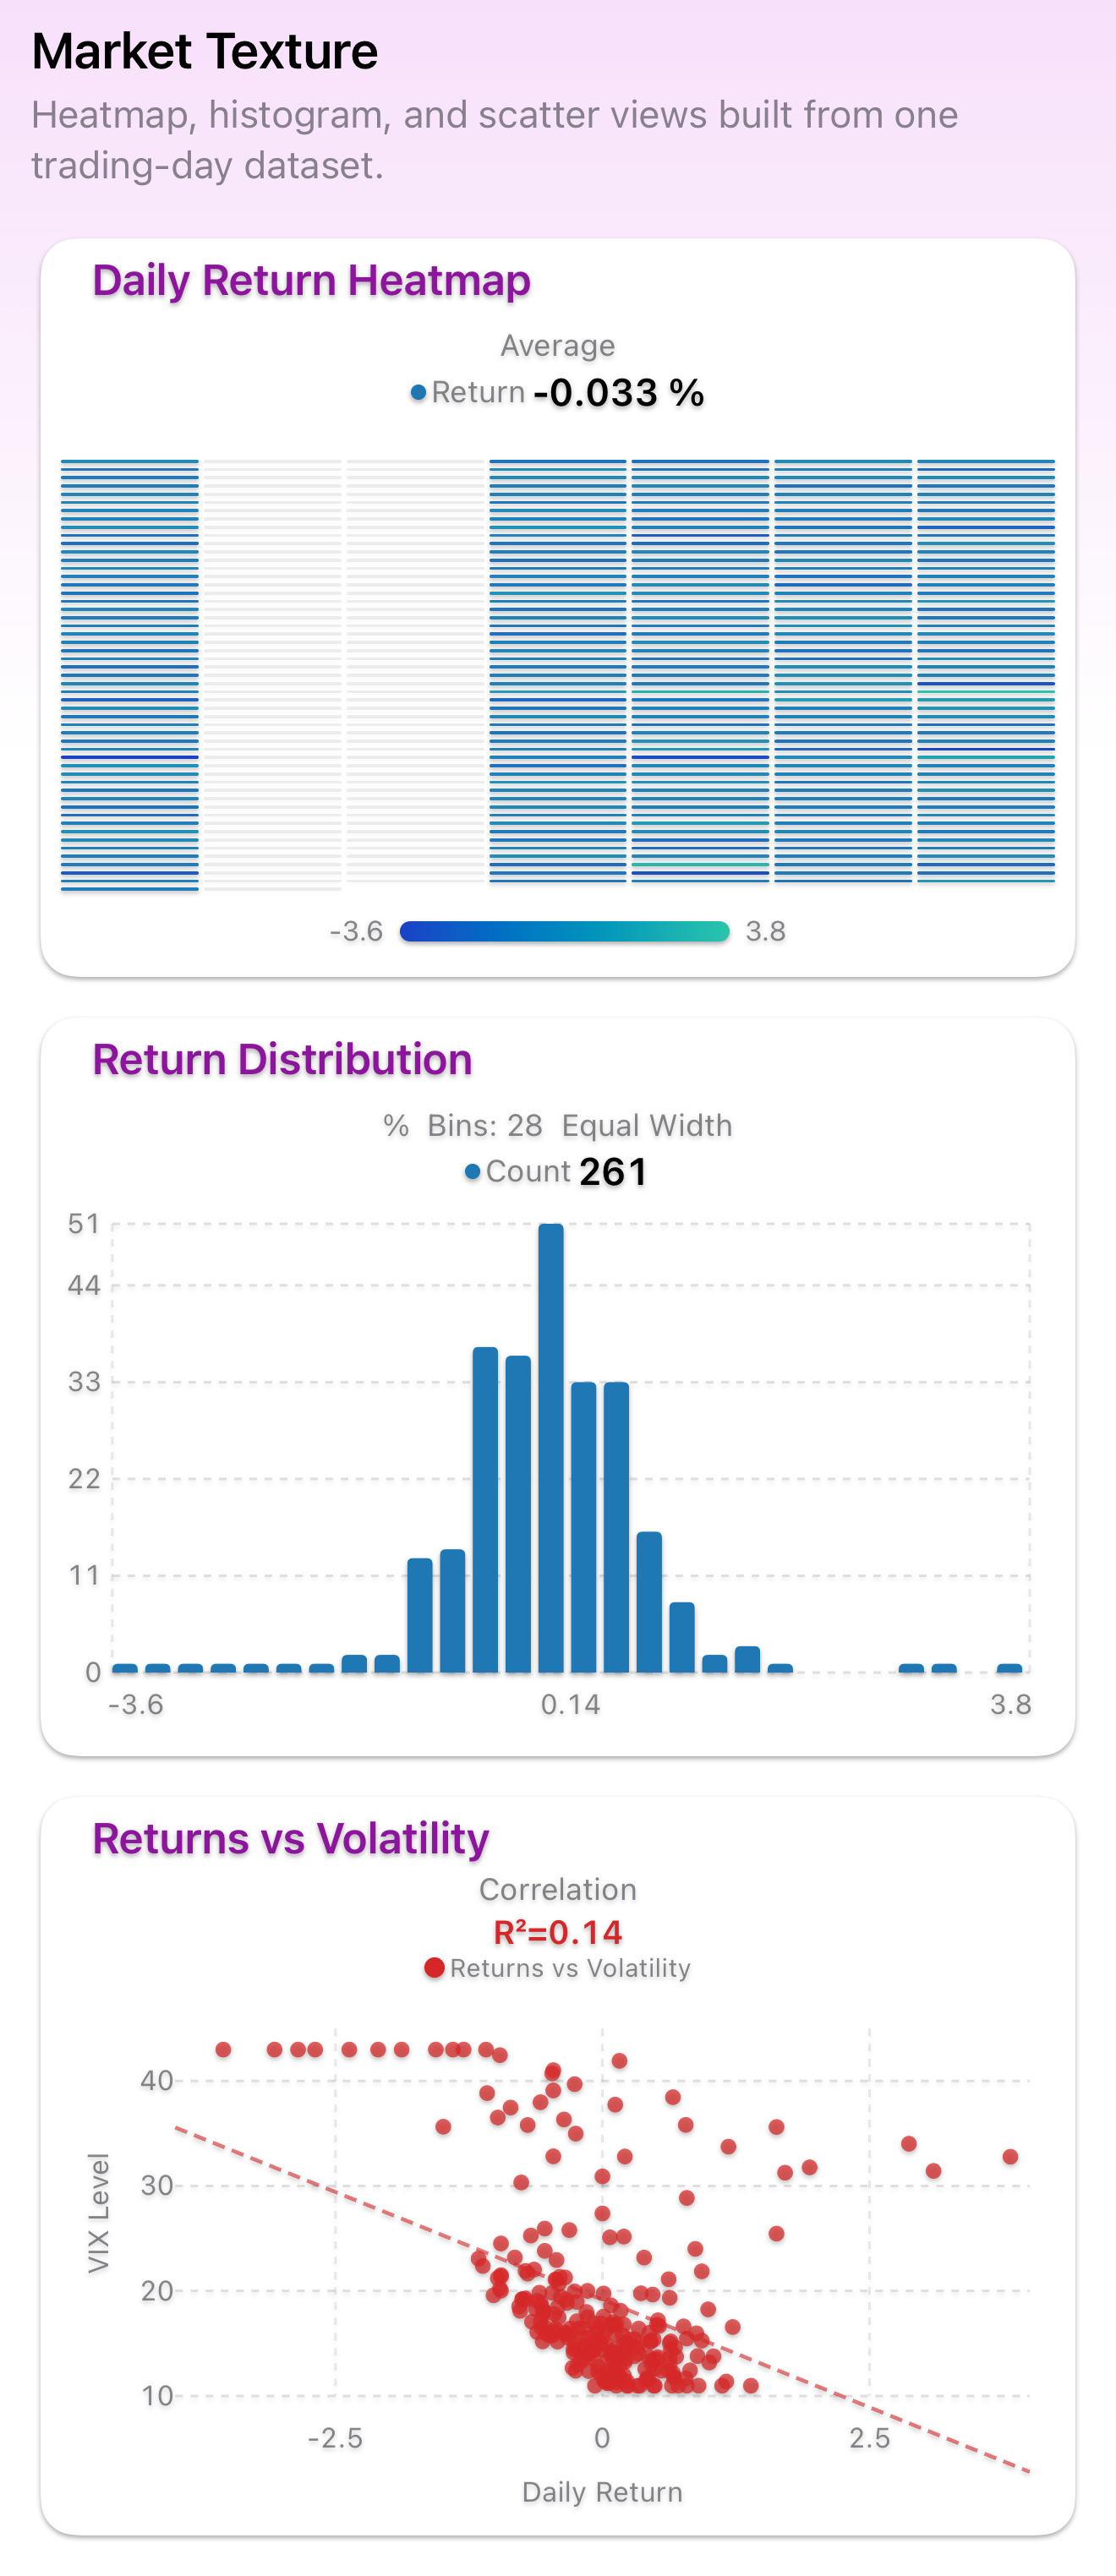
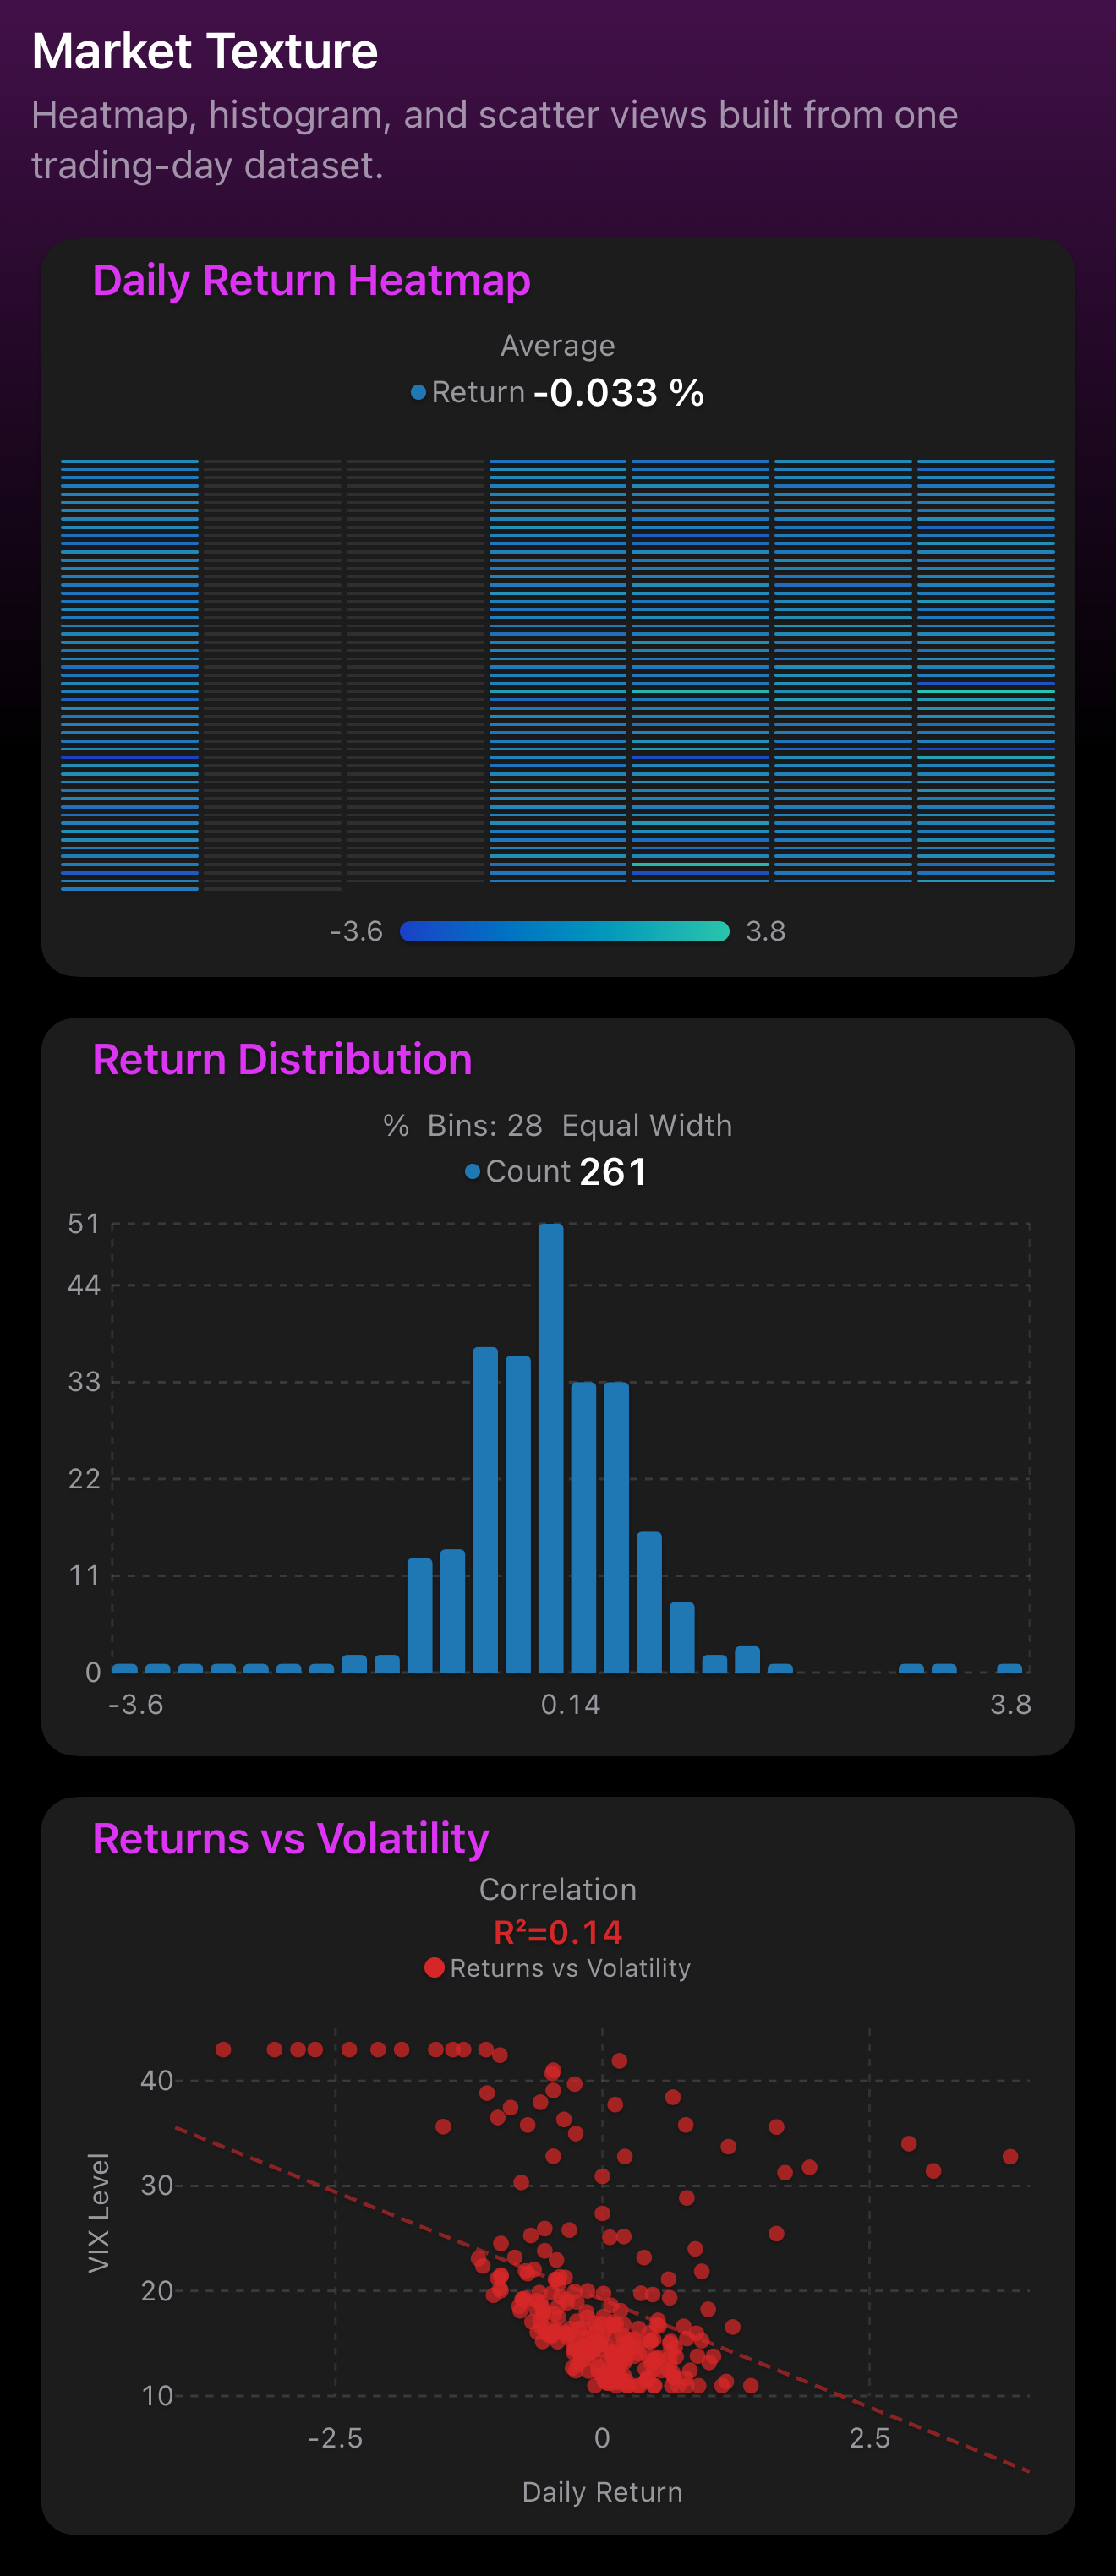
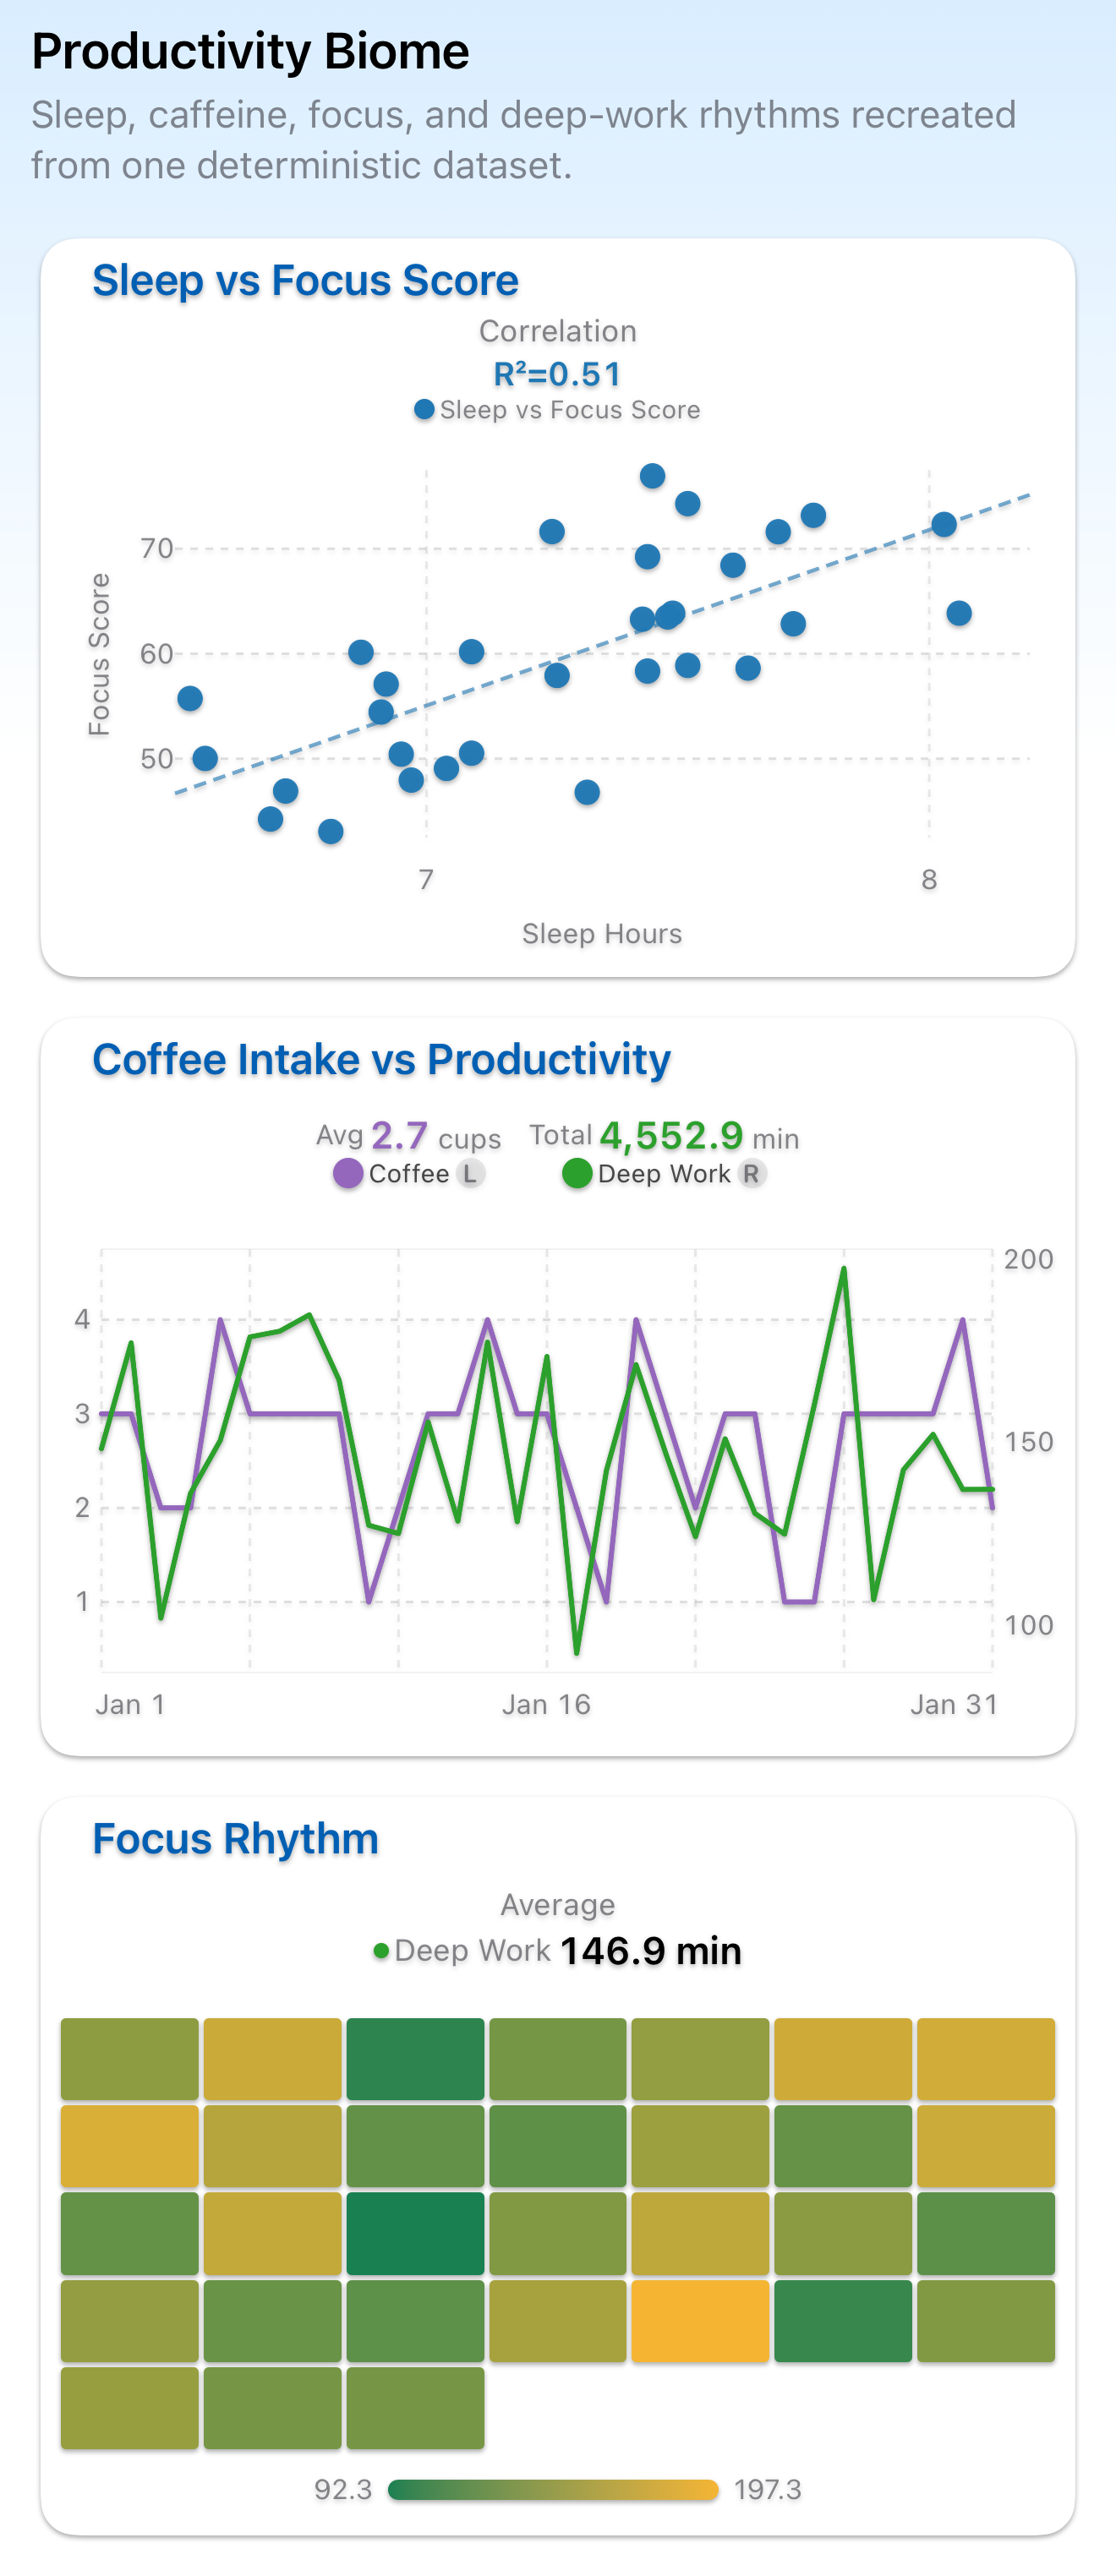
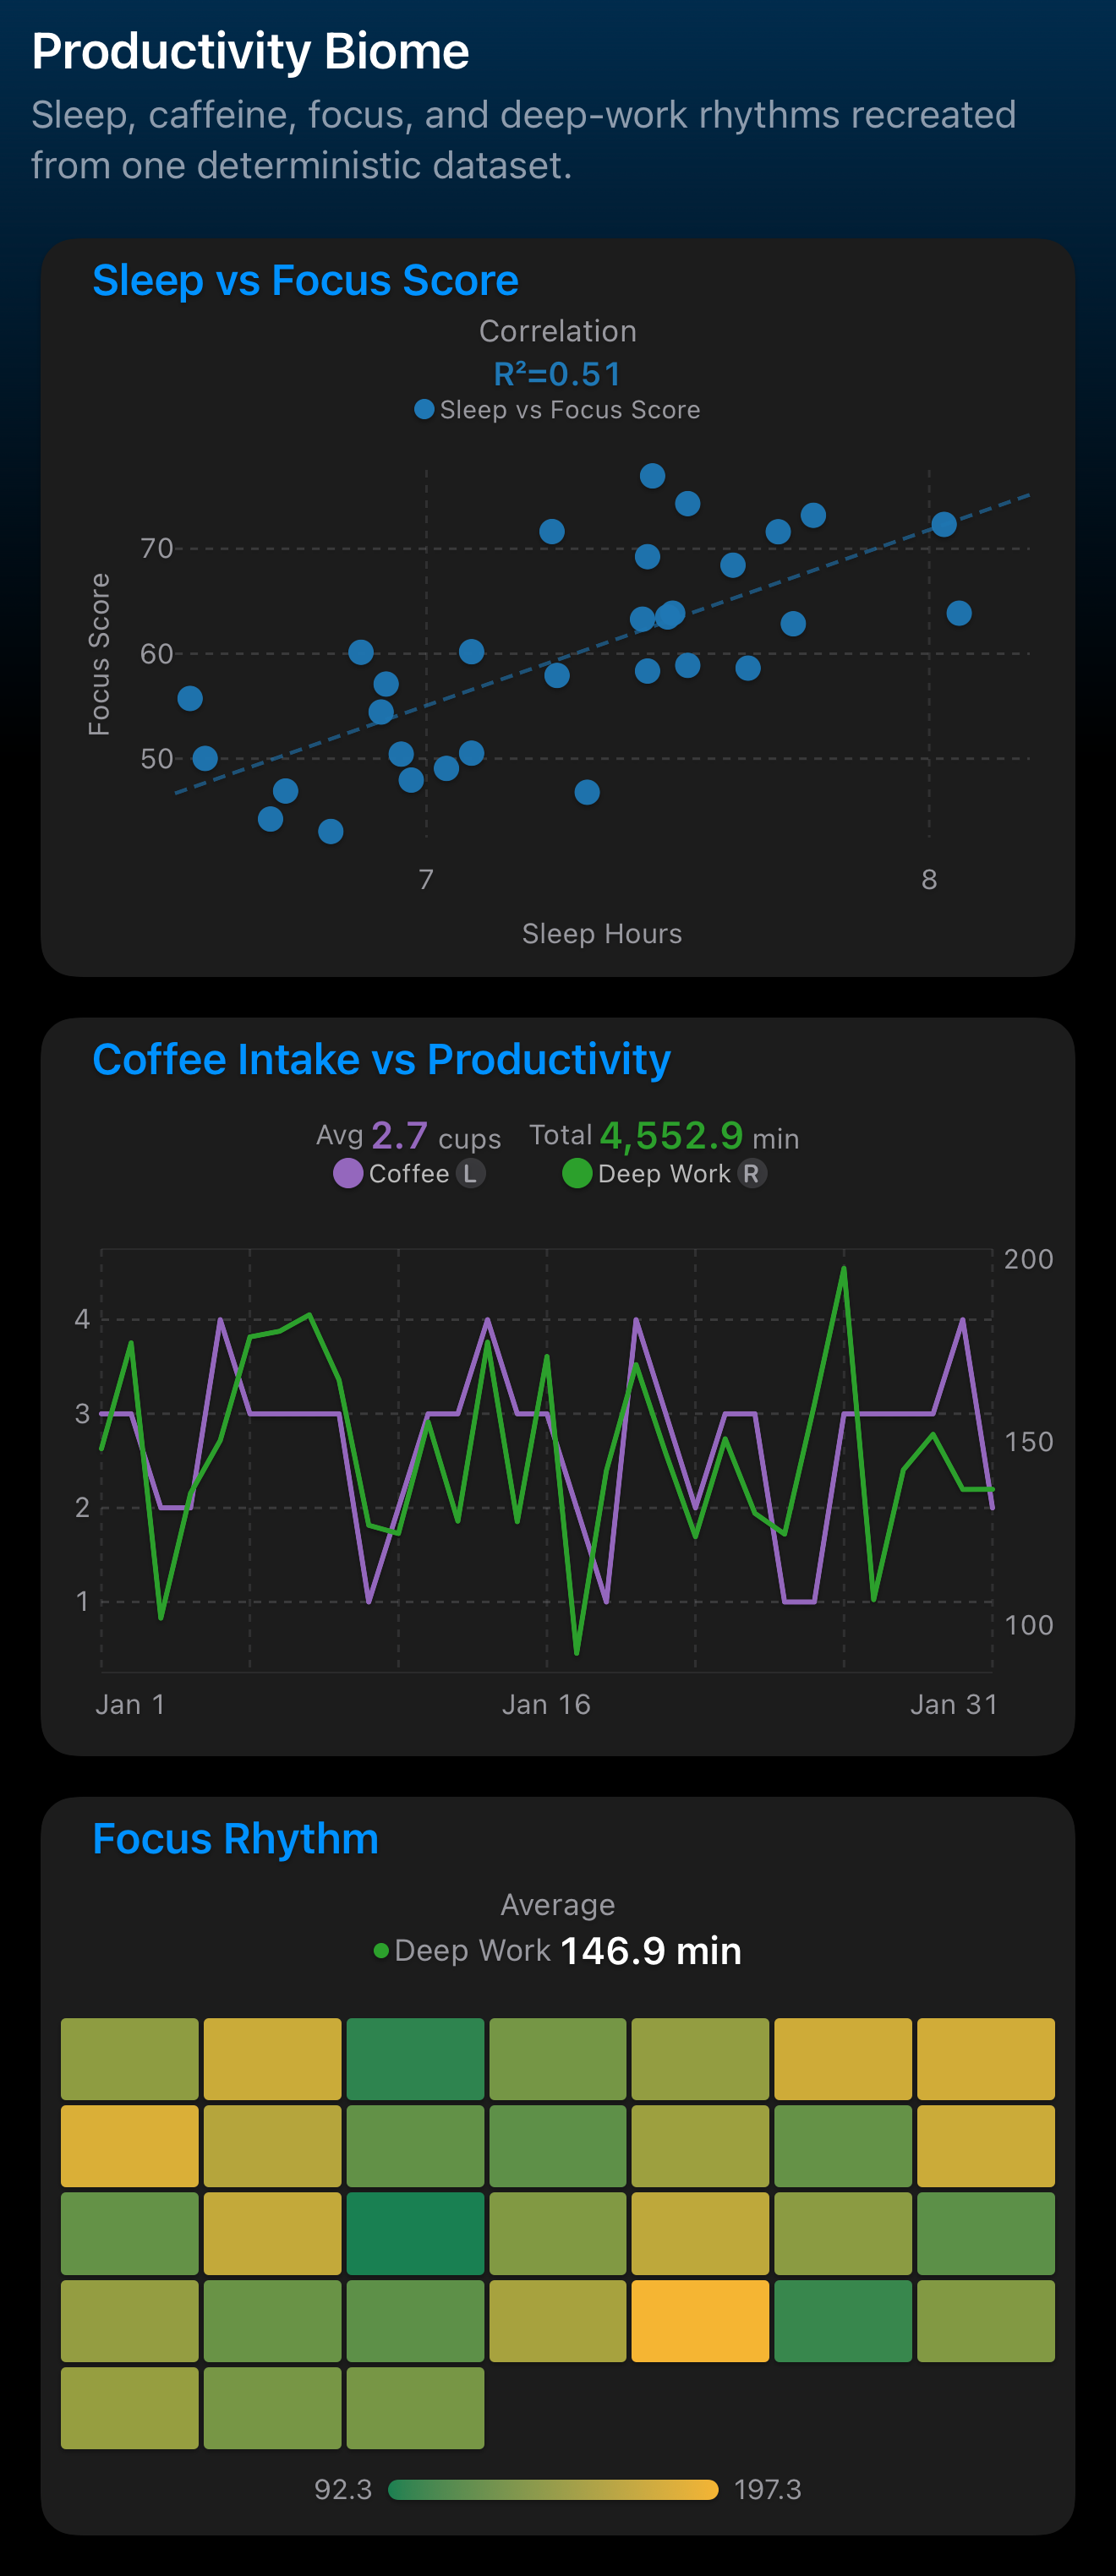
Overlay seemingly unrelated data — market indices and sleep quality, weather and productivity — and watch patterns emerge that no single app could ever reveal.

Market Stress Decade dashboard showing dramatic red and blue patterns Market Stress Decade dashboard in dark mode

Pricing

Start

Free

To discover VoilàSense.

  • 3 dashboards, 4 graphs each
  • Line and Bar charts
  • 2 series per graph
  • 30 days of history
Download on the App Store

Plus

$4.99 / month

The full experience for regular use.

  • 10 dashboards, 12 graphs each
  • + Area charts
  • 4 series per graph
  • 1 year of history
  • Basic formulas
  • CSV import & export
Upgrade to Plus
  • Cancel anytime
  • Your data stays private — always

Prices may vary by country and region.
The final price is shown in the App Store.

Reveal the sense in your data

Free to start. No account required.